
Misconceptions can be recycled, too.
Plastic: Sorting Fact from Fiction
12 questions to better understand and take better action
A continent of waste? A credit card on your plate? Packaging that disappears on its own? When it comes to plastic, some slogans travel faster than the facts.
No lectures or all-caps catastrophes here. Just the questions we ask ourselves, documented answers, and ways to take action. Each article specifies what the sources allow us to say, their limitations, and the date of the figures used. Because understanding the problem is the first step towards choosing better solutions.
Last documentary review: 26.10.2026, The SeaCleaners Swiss
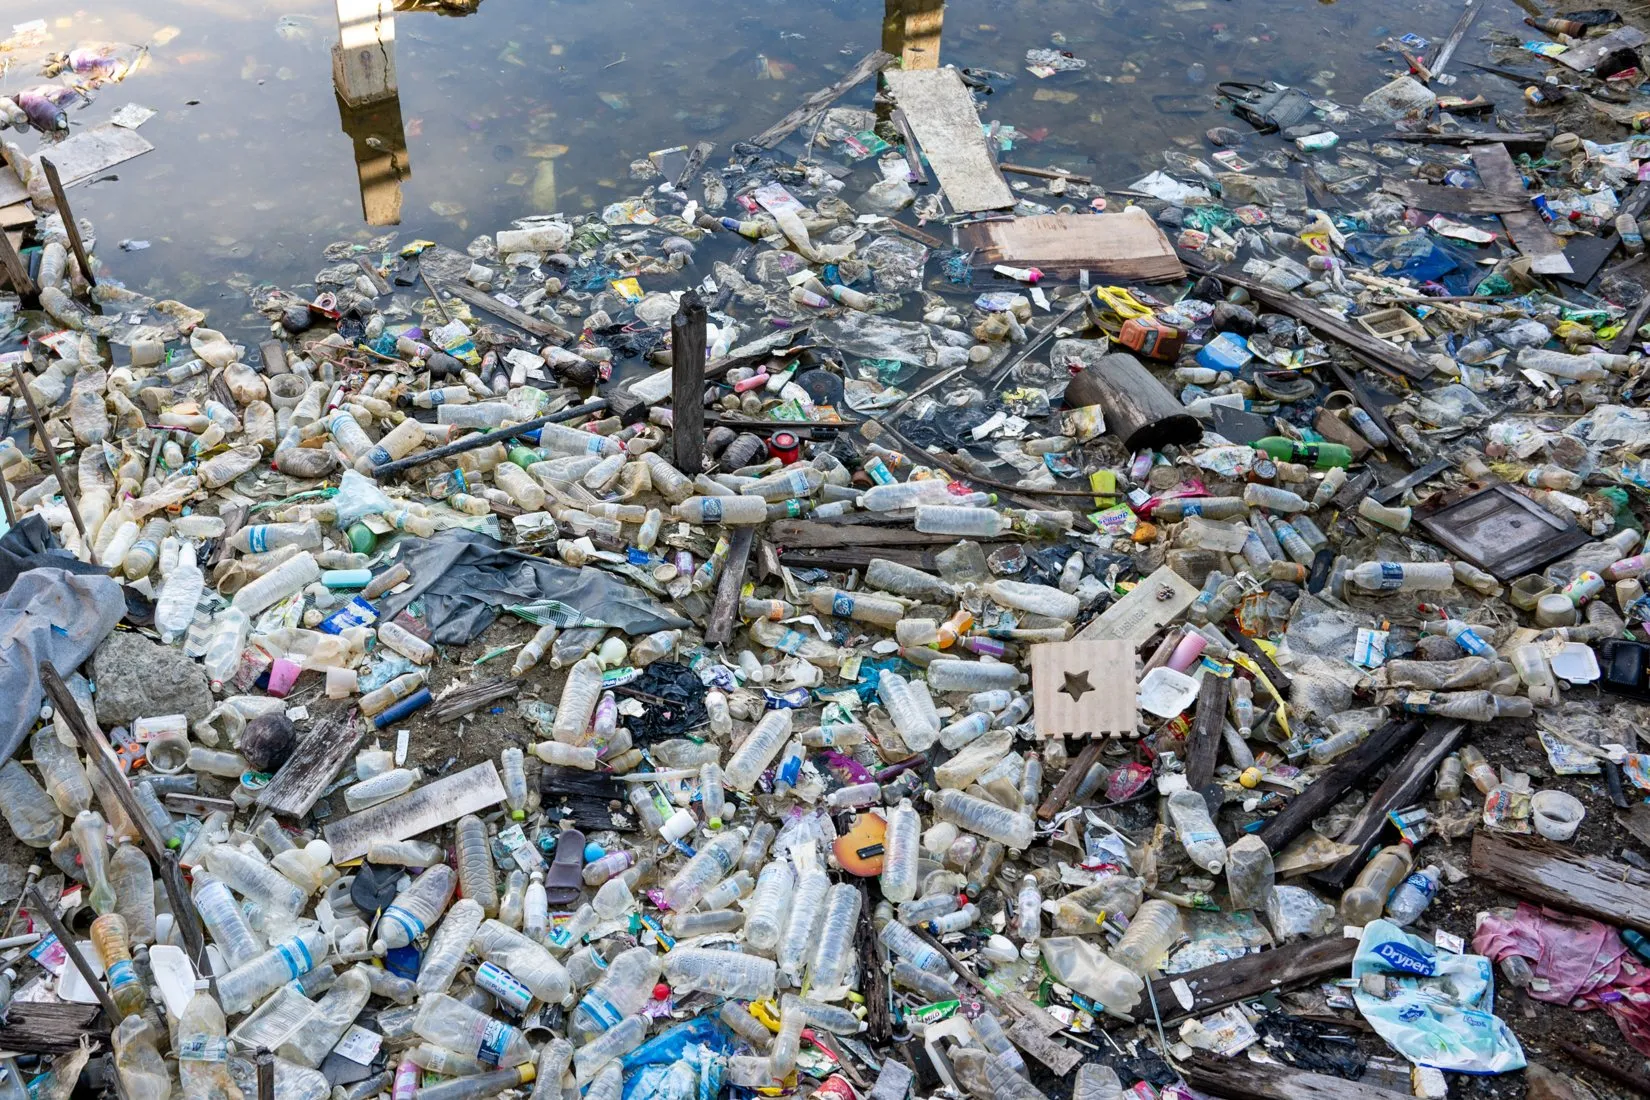
Plastic waste accumulated at the water's edge.
Reality is enough to justify action.
There is no need to exaggerate to inspire people to act.
12 misconceptions put to the test
01OCEANThe 7th continent: a plastic island you could walk on?FALSE
The Verdict
No. The "continent" is a metaphor: it is an accumulation zone of scattered waste, not solid ground.
Reading time: approx. 3 minutes | Sources reviewed on 26.10.2026
A new continent in the middle of the Pacific? The phrase is striking, but it draws the wrong map. To understand pollution at sea, it is better to imagine a vast area where currents gather waste of all sizes. [1, 2]
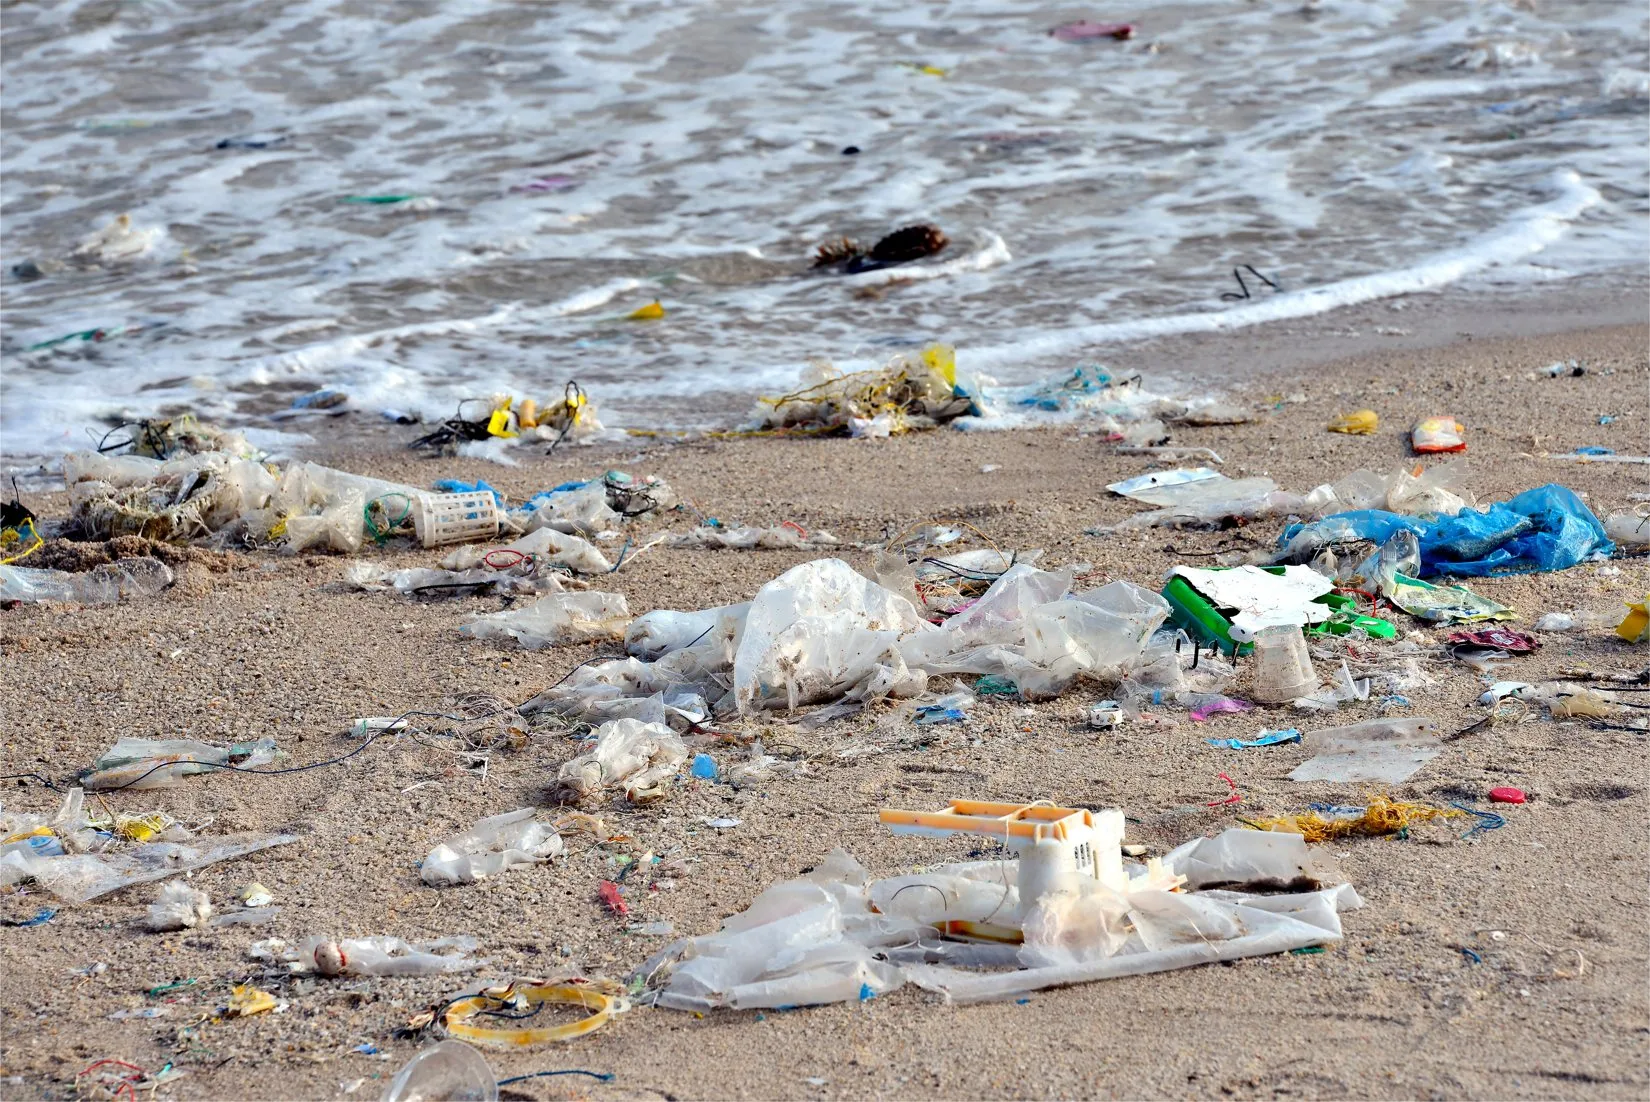
Plastic waste washed up on a beach. This coastal accumulation is not a photograph of the North Pacific zone.
A concentration, not a construction
In the North Pacific, currents promote the accumulation of floating plastics. The debris remains mobile, unevenly distributed, and often difficult to see. There is no shoreline or solid surface. The NOAA also points out that large accumulation zones do not look like photographs of ports saturated with waste: these coastal situations exist, but they do not represent the open sea. [2]
An impressive figure, with its user manual
A study published in 2018, based on observations from 2015 and 2016, estimated this area at approximately 1.6 million square kilometres and the mass of plastic present at approximately 79,000 tons. These are scientific estimates for a specific location, dates, and method, not an updated measurement of all oceans. The surface area indicated is that of the study zone, not that of a continuous carpet of plastic. [1]
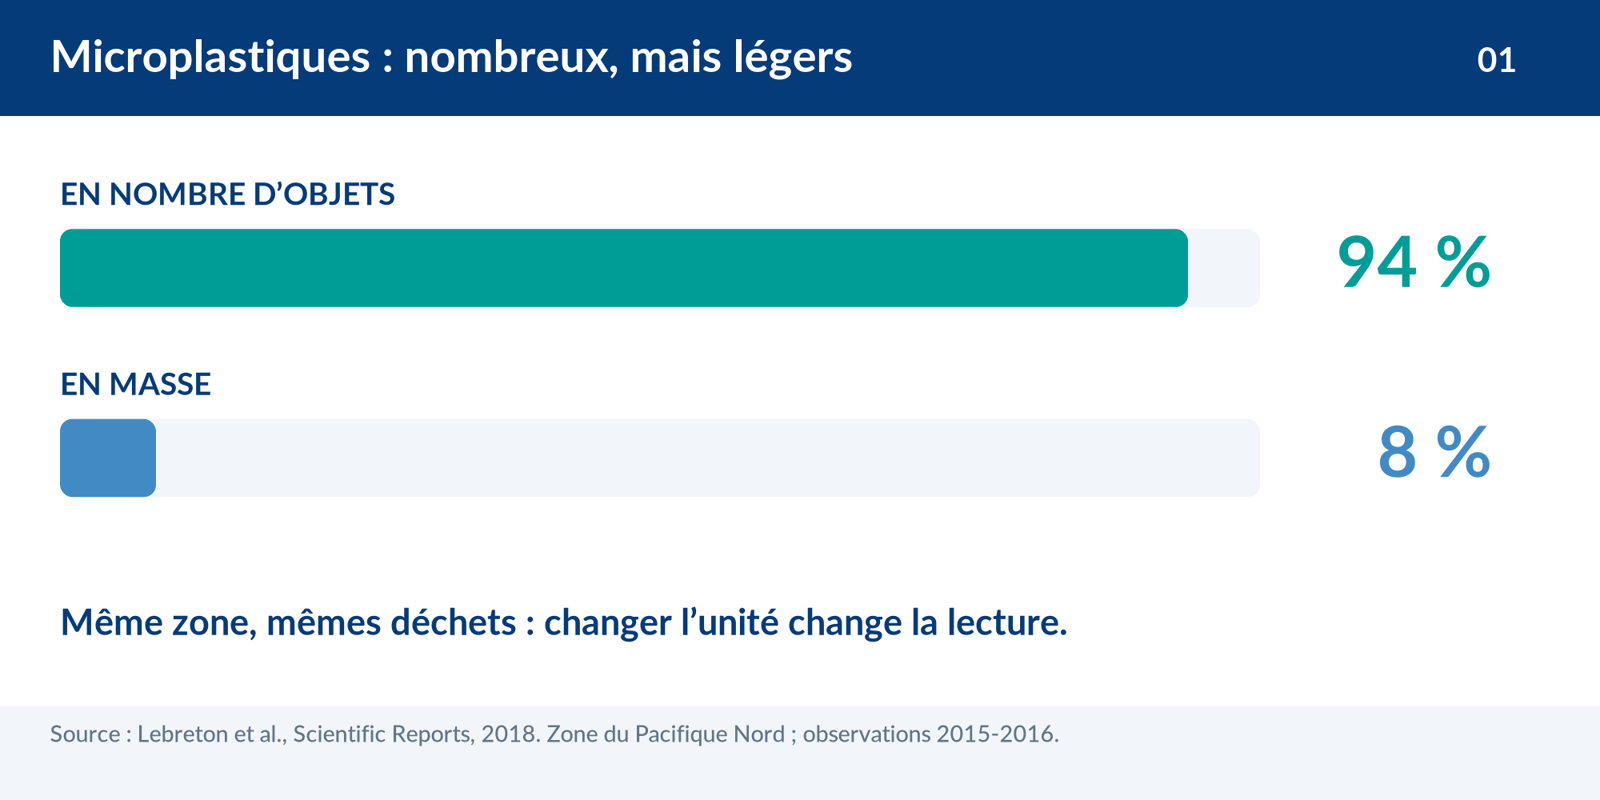
Counting pieces or weighing them: 2 different stories
In this same study, microplastics accounted for 94% of the number of objects, but only 8% of their mass. Many small fragments can therefore coexist with a few large, very heavy objects. [1] The right question, when faced with a percentage, is always: "what are we talking about?" A number of pieces cannot be directly compared to tons. This distinction changes how we read an image, a figure, and the collection needs.
Fewer shortcuts, more solutions
This diffuse reality does not make action useless: it invites action in several places. Prevention limits arrivals, while targeted collections remove part of the waste already present. [2] At The SeaCleaners, our choice is to intervene in rivers, ports, and bays, with local stakeholders. A boat, a beach, or a recycling plant will not solve everything alone. Together, they can be part of a coherent response.
The right reflex: before sharing a photo of a "plastic continent," let's check its location and caption. An accurate image raises awareness better than a spectacular image that is poorly explained.
Sources and further reading
02RIVERSAre 10 rivers responsible for almost all plastic at sea?FALSE
The Verdict
No. This formula confuses an old model of river inputs with overall ocean pollution.
Reading time: approx. 3 minutes | Sources reviewed on 26.10.2026
Clean up 10 rivers, and the problem would be solved? That would be convenient. But waste takes many more paths, and small rivers also have a role to play. [1, 2]
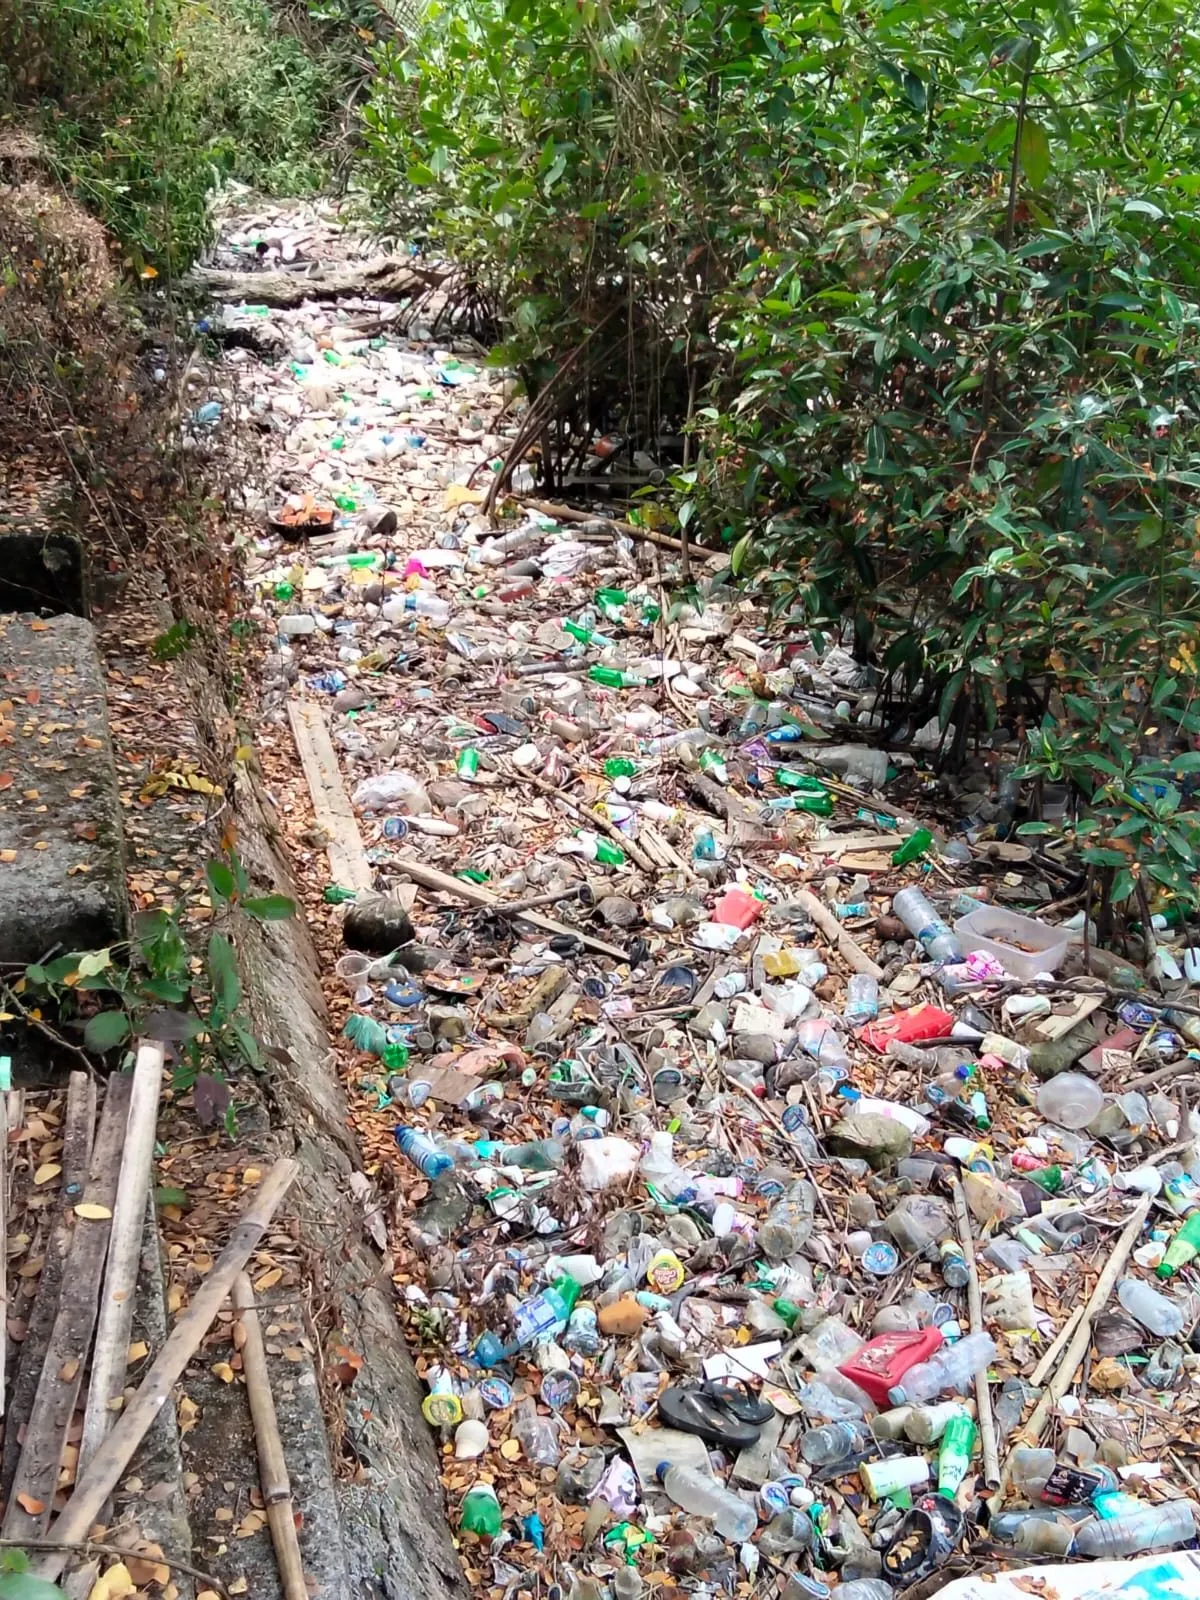
A dry watercourse, cluttered with plastic waste: with the next rain, it will be washed downstream. This image illustrates the subject without proving the origin of the waste.
The small word that changes everything: "riverine"
A 2017 study estimated that 10 rivers carried a very large share of plastic inputs from rivers. It did not say that 10 rivers explained all the plastic present in the ocean. Its authors also highlighted uncertainties related to the lack of data. [1] In moving from a scientific article to a viral slogan, the distinction between "riverine discharge" and "total marine pollution" was often lost. Yet the denominator matters as much as the percentage.
A much more branched map
In 2021, another global model estimated that more than 1,000 rivers contributed to approximately 80% of riverine plastic emissions into the ocean. It particularly highlights small urban waterways. [2] This result does not mean that every river was measured continuously. It is an estimate linking observations and transport factors. Nor is it an immutable ranking: infrastructure, rainfall, and usage evolve.
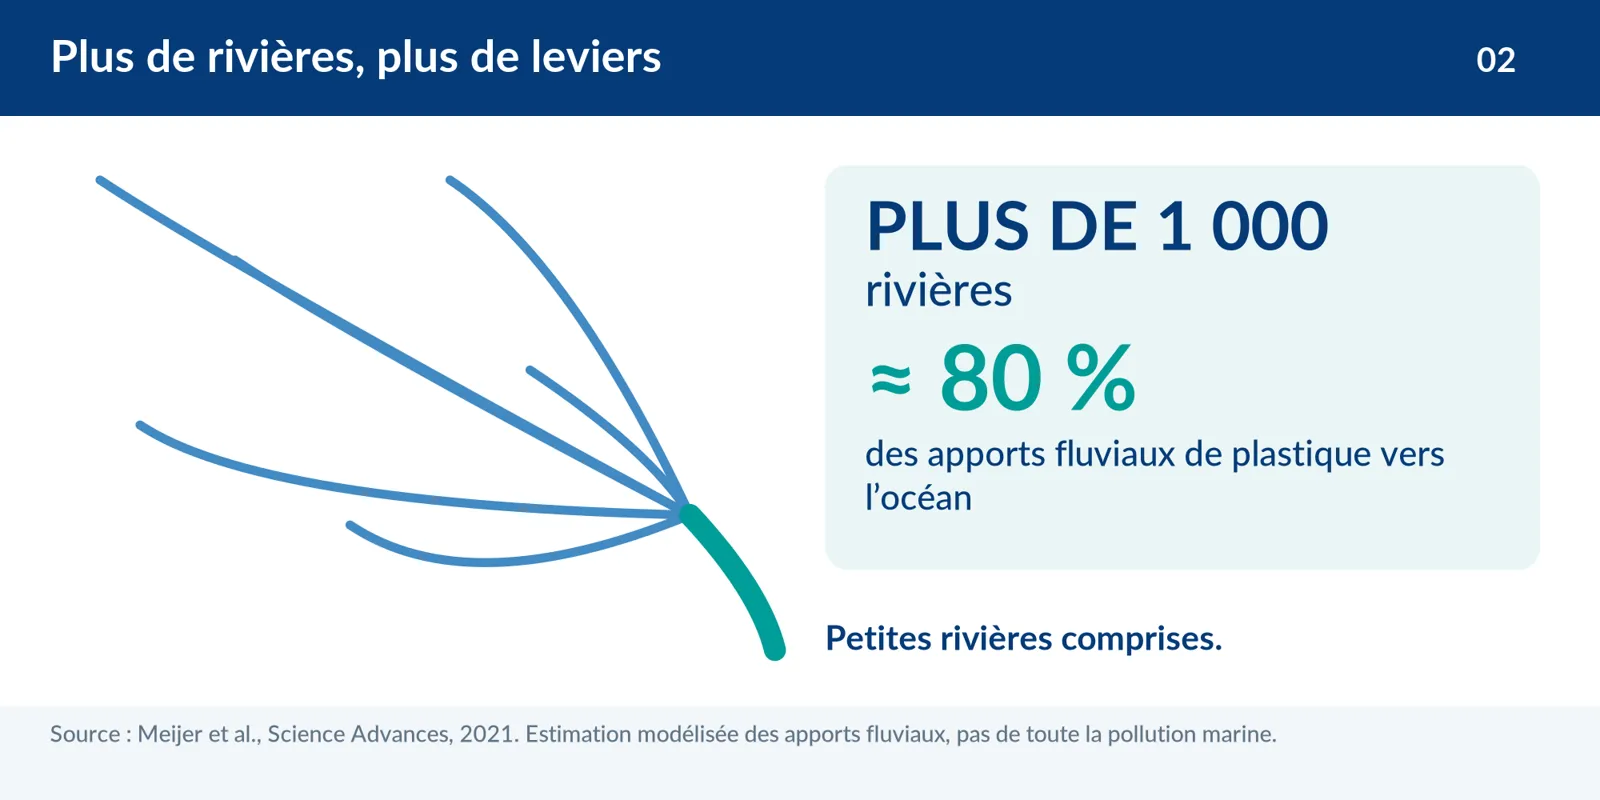
The size of the river isn't everything
The path between waste and the sea depends notably on its proximity to water, waste management, and precipitation. A small river flowing through a city near the coast can therefore carry significant quantities. [2] Other waste reaches the coast directly or comes from maritime activities. [3] The right diagnosis must specify what it counts: annual inputs, accumulated stock, visible objects, or particles.
Solutions at the right scale
Our conclusion is not that we should put a boat in every stream. It is that a solution must start from local reality: where does waste accumulate, how does it arrive, and who takes charge of it after collection? In Ambon, our programme will combine collection in the bay, awareness-raising, and work with local partners. Each site has its own diagnosis and means of action. It is more demanding than a list of 10 rivers, but much more useful for building a sustainable programme.
The right reflex: also observe the waterways near your home. A river does not need to be famous to deserve being cared for.
Sources and further reading
- [1] Schmidt et al., Environmental Science & Technology, 2017. Export of Plastic Debris by Rivers into the Sea. View ↗
- [2] Meijer et al., Science Advances, 2021. More than 1000 rivers account for 80% of global riverine plastic emissions into the ocean. View ↗
- [3] Kaandorp et al., Nature Geoscience, 2023. Global mass of buoyant marine plastics dominated by large long-lived debris. View ↗
03ORIGINSIs plastic at sea mostly from fishing?IT DEPENDS
The Verdict
It depends on the location, the type of waste, and the way it is counted. A local figure does not describe all oceans.
Reading time: approx. 3 minutes | Sources reviewed on 26.10.2026
Nets, ropes, bottles, packaging: very different objects are hidden under the word "plastic." To find the right solutions, let's start by looking at what is actually collected, and where. [1, 2]
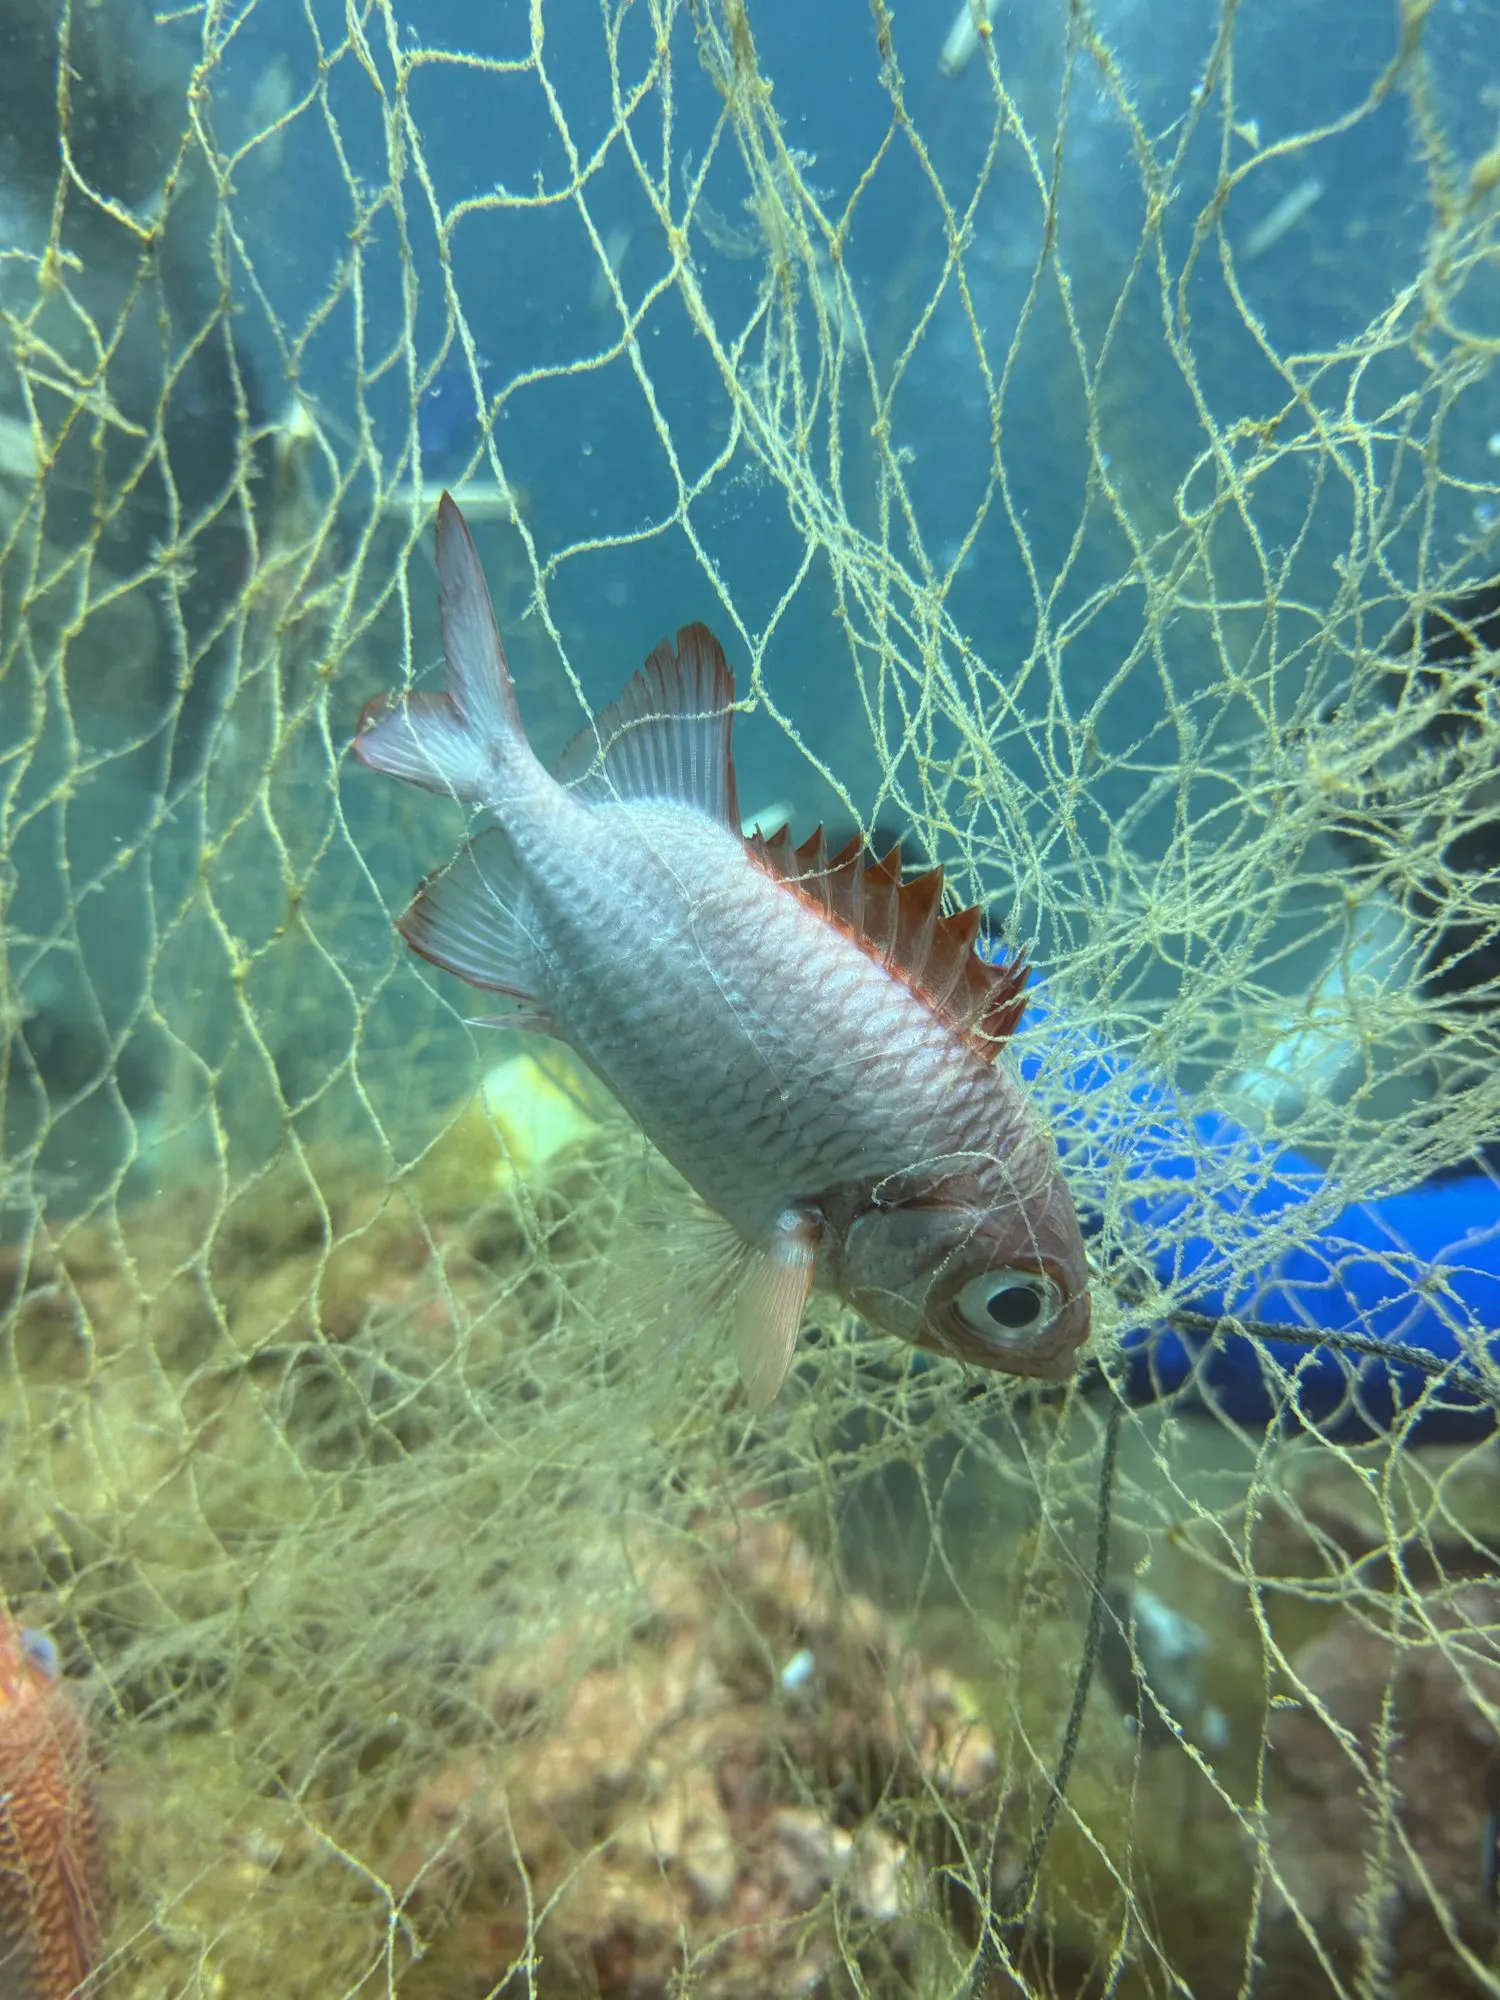
A fish trapped in an abandoned net off Kota Kinabalu: this is what is known as ghost fishing.
An accurate figure, sometimes placed in the wrong spot
In the North Pacific accumulation zone studied in 2015 to 2016, fishing nets accounted for at least 46% of the estimated plastic mass. [1] This result concerns nets, in that zone, by weight. It does not mean that 46% of all global plastic waste comes from fishing. Turning this observation into a universal verdict would be like describing all the streets in a city based on a single square.
A lost net can continue to fish
Abandoned, lost, or discarded gear can trap animals, damage habitats, and hinder navigation. This is notably the phenomenon of "ghost fishing." [2] But a lost net is not automatically a net thrown away voluntarily: the circumstances of loss are diverse. The objective is therefore not to designate fishers as adversaries, but to build with them ways to prevent losses, report them, and recover gear when possible. [3]
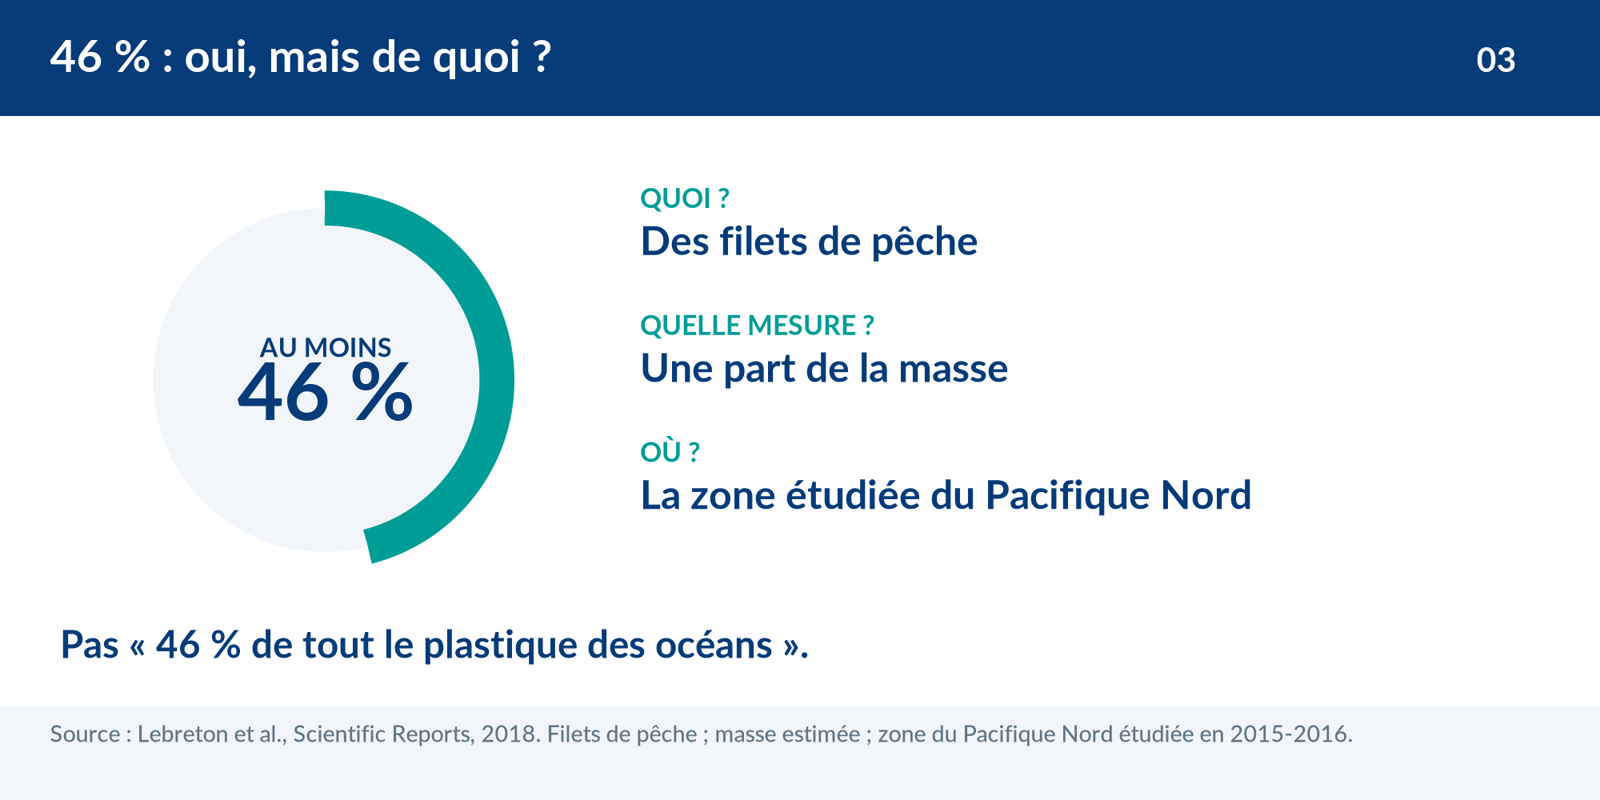
Not all waste tells the same story
The composition observed offshore cannot be copied onto that of a beach or a bay. Transport models distinguish inputs from rivers, coasts, and fishing activities, as well as the ability of objects to float and persist. [4] For us, a collection must therefore be accompanied by observations: types of objects, quantities, and locations. This information guides a diagnosis; it does not, on its own, prove the exact origin of each object.
Preventing at sea as on land
The FAO notably recommends gear marking, loss reporting systems, and adapted recovery programmes. [2, 3] These measures complement waste prevention on land: neither cancels out the other. In our programmes, we seek the same complementarity with local stakeholders. Better understanding what arrives in a bay allows for dialogue based on facts and the choice of actions, rather than pitting ocean users against each other.
The right reflex: do not attempt to remove dangerous gear or gear entangled with animals alone. Reporting its location to the relevant services or associations is already a useful contribution.
Sources and further reading
- [1] Lebreton et al., Scientific Reports, 2018. Evidence that the Great Pacific Garbage Patch is rapidly accumulating plastic. Observations 2015 to 2016. View ↗
- [2] FAO and IMO, 2022. Reporting and retrieval of lost fishing gear: recommendations for developing effective programmes. View ↗
- [3] FAO. Abandoned, Lost or otherwise Discarded Fishing Gear; guidelines on the marking of fishing gear. View ↗
- [4] Kaandorp et al., Nature Geoscience, 2023. Global mass of buoyant marine plastics dominated by large long-lived debris. View ↗
04RECYCLINGIf I sort my plastic, is the problem solved?NOT SO SIMPLE
The Verdict
Sorting is useful. But recyclable, collected for recycling, and effectively recycled do not mean the same thing.
Reading time: approx. 3 minutes | Sources reviewed on 26.10.2026
The right bin is a start, not a magic wand. Waste must still be sorted, prepared, and transformed in a system that works. Good news: better understanding this journey helps in making better choices. [1, 2]
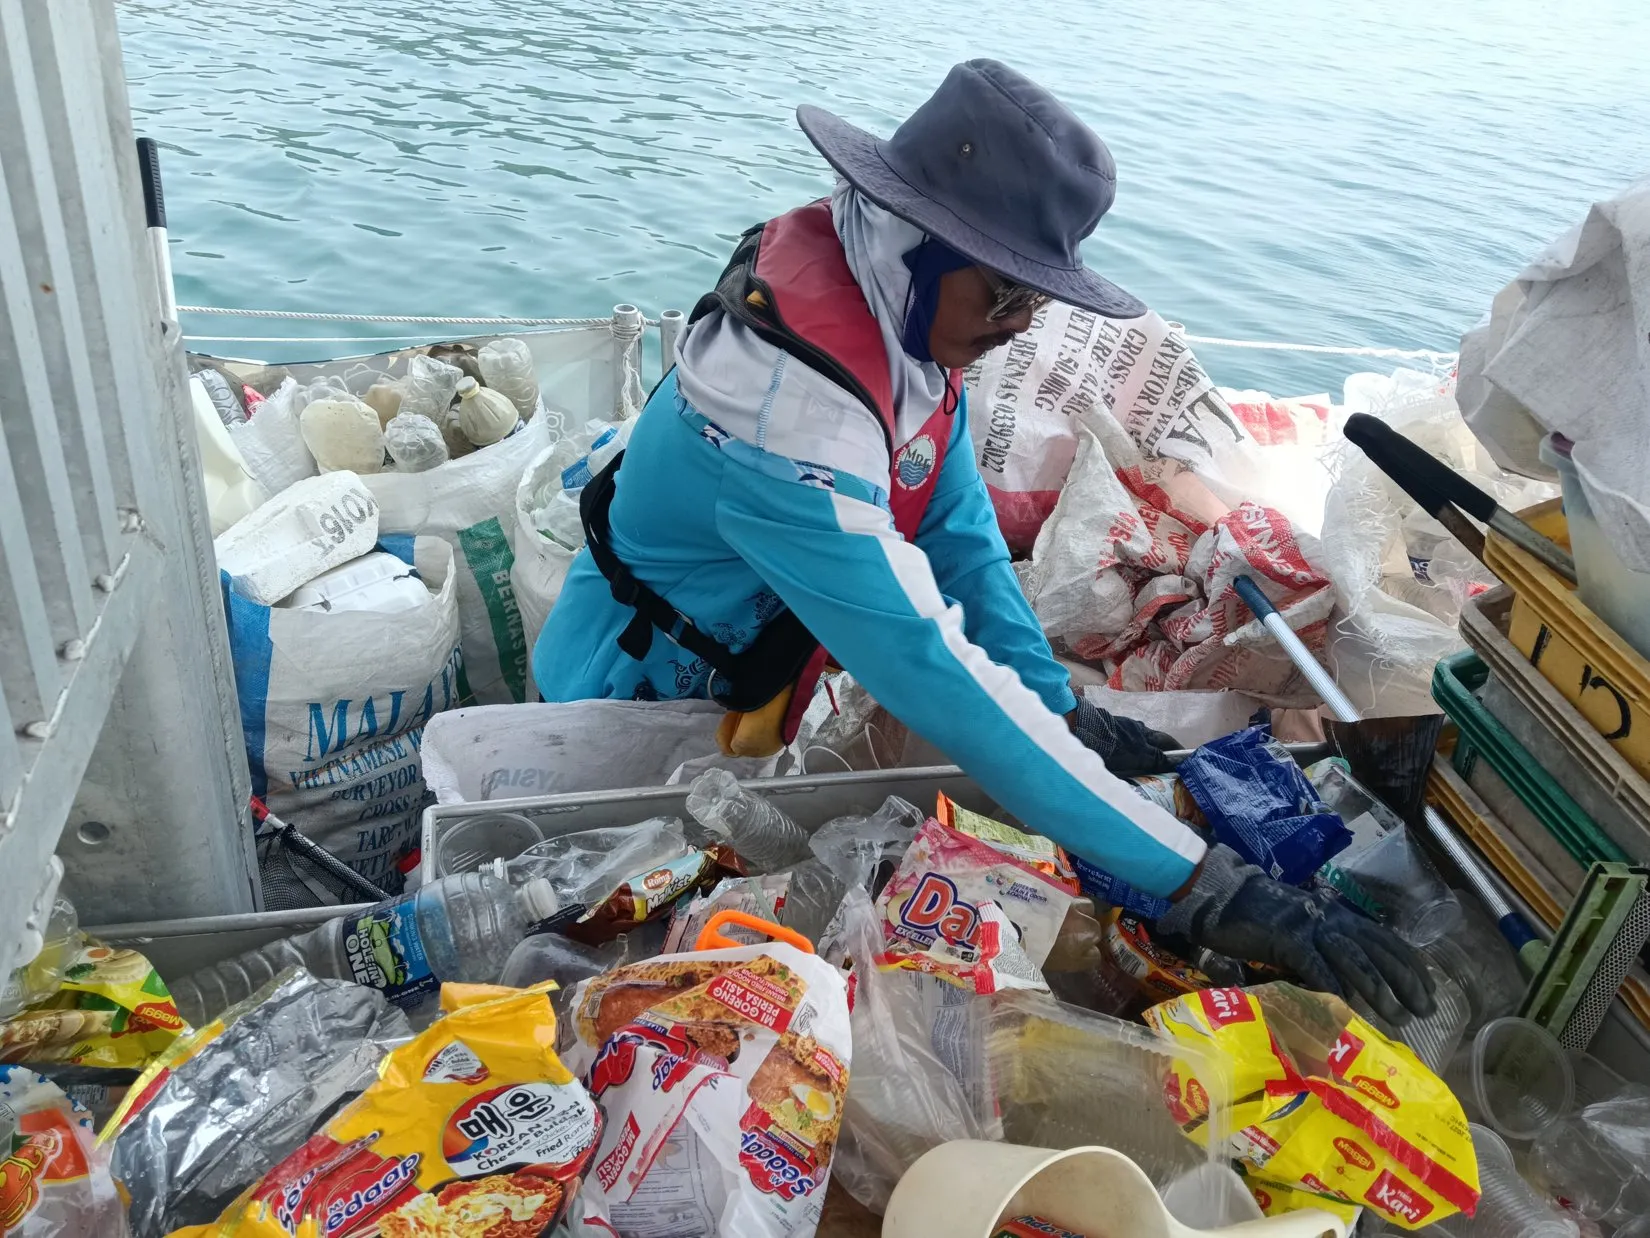
Sorting waste collected on board the Mobula 8.2 in Kota Kinabalu: sorting and monitoring its fate extends the work at sea.
The famous 9% has a date
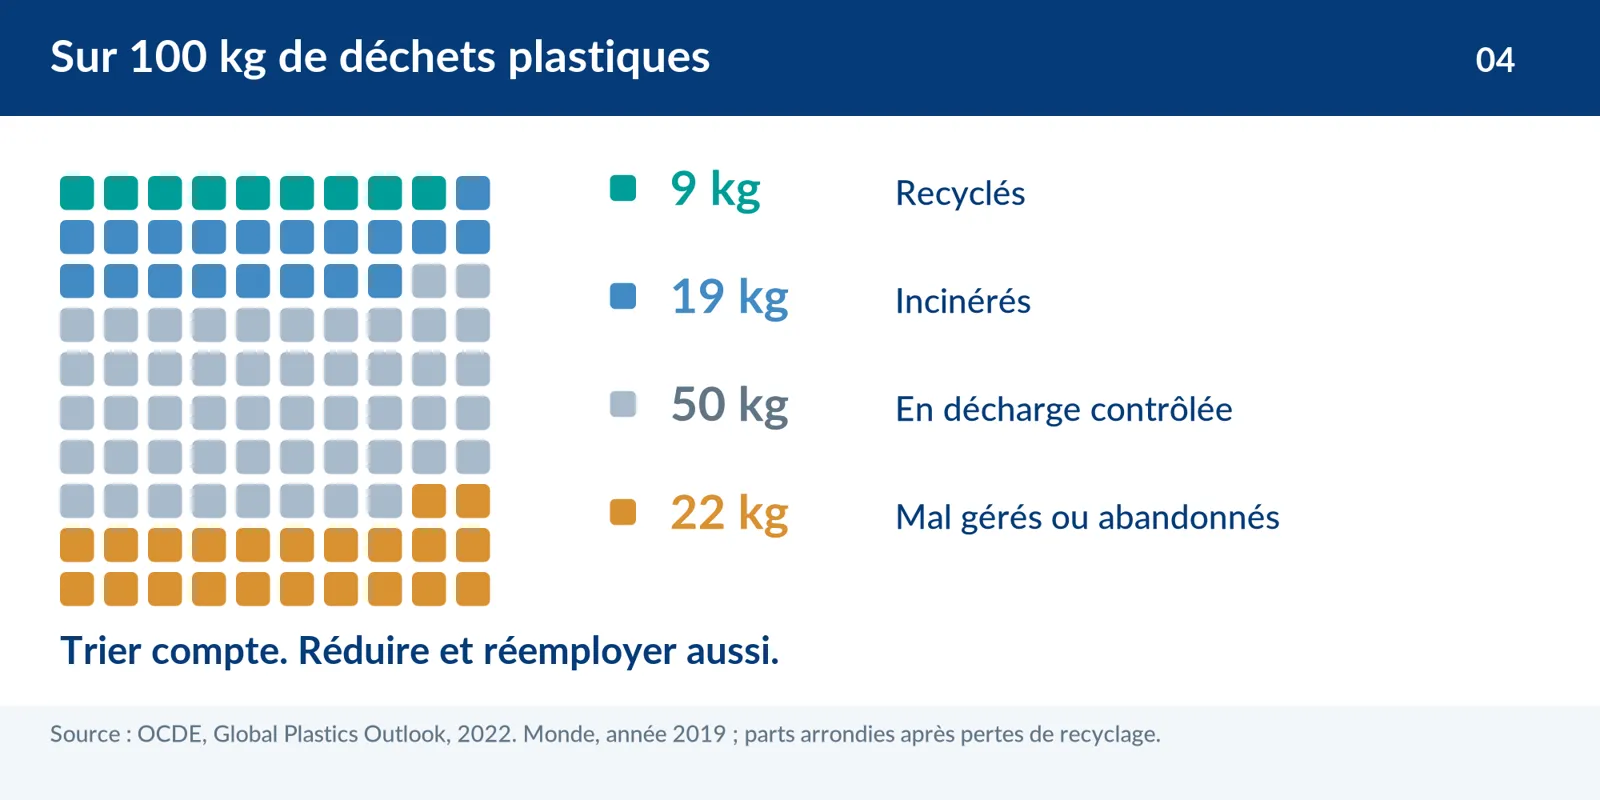
According to the OECD, approximately 9% of plastic waste produced worldwide in 2019 was ultimately recycled. Approximately 19% was incinerated and 50% placed in sanitary landfills; the remaining 22% was mismanaged or abandoned. [1] This 2019 global assessment, published in 2022, is neither the current rate for each country nor that of a specific bottle. Systems and results vary by product and territory.
Recyclable does not mean recycled
An object can be technically recyclable without being handled by local collection. It can also be collected and then discarded during sorting. On a global scale, the OECD thus distinguishes volumes collected for recycling from volumes effectively recycled, after processing losses. [1] That is why the symbol on the packaging does not replace the instructions from the municipality or the collector. The right action starts with the right information, not with the desire to put everything in the same bin.
What about incineration with energy recovery?
Producing heat or electricity from waste constitutes energy recovery. This does not transform plastic into new material. The FOEN distinguishes these treatment pathways in Swiss management. [3] To read an assessment, three questions must therefore be separated: how much was collected, how much was recycled into material, and how was the rest treated? A "recovery" percentage does not necessarily answer all three.
Recycling is a link, not the whole chain
The UNEP proposes combining the reduction of problematic uses, reuse, better design, and recycling. [2] The idea is not to abandon sorting because it is imperfect: it is to prevent it from serving as an excuse to produce ever more waste. In our expeditions, collection is accompanied by work with local systems. We do not promise a second life for every object: our goal is to document its fate and improve its handling.
The right reflex: reduce what can be reduced, reuse what is designed to last, then follow local sorting instructions. These are complementary actions, not competing options.
Sources and further reading
- [1] OECD, 2022. Global Plastics Outlook, Chapter 2. Global data for 2019. View ↗
- [2] UNEP, 2023. Turning off the Tap: How the world can end plastic pollution and create a circular economy. View ↗
- [3] FOEN. Plastics in the environment, page from 31.07.2025. Estimates of annual inputs in Switzerland. View ↗
05SWITZERLANDSwitzerland has no sea: why talk about plastic pollution here?CONCERNED
The Verdict
Because plastic also reaches our soils, lakes, and rivers. The absence of a coastline is not a protection.
Reading time: approx. 3 minutes | Sources reviewed on 26.10.2026
You don't need a ticket to the tropics to encounter plastic pollution. It also exists on the shores of a lake, in a waterway, and even in Swiss soils. And that is precisely a good reason to start acting close to home. [1]
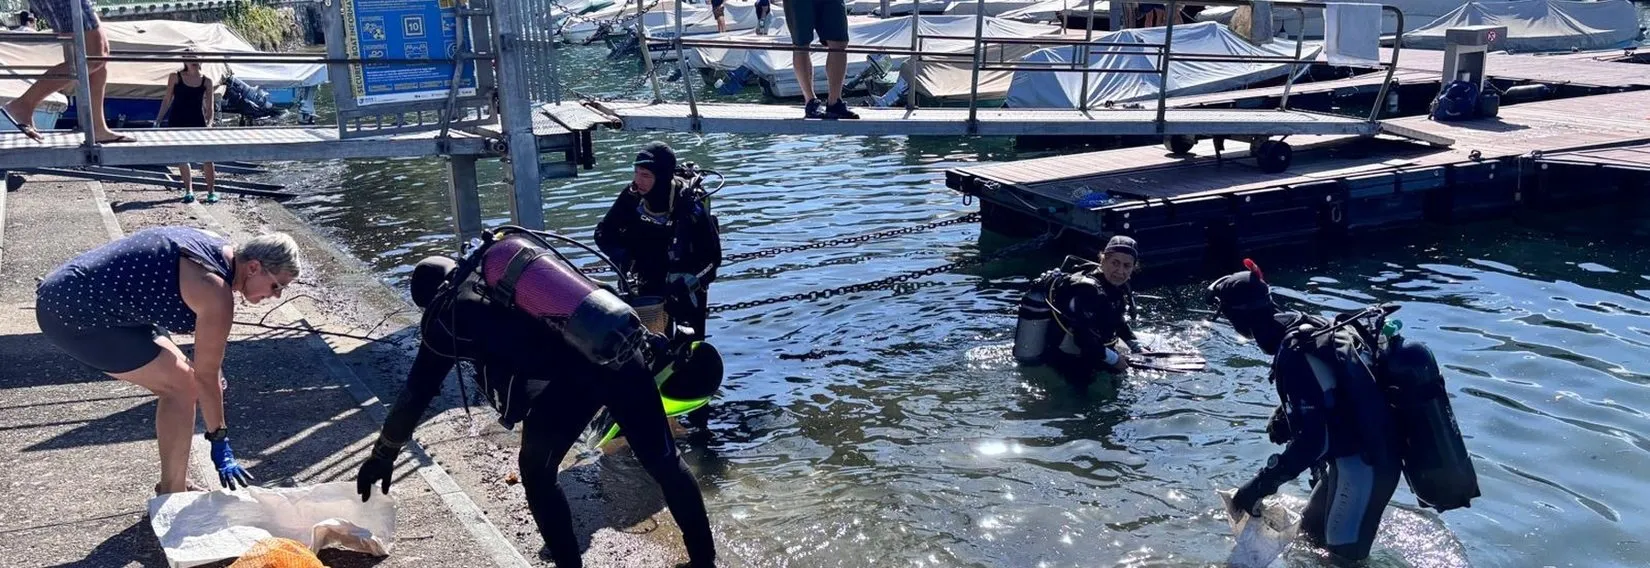
A cleanup operation at Lake Lugano, with divers and volunteers. Photo: Fondali Puliti del Ceresio.
A national estimate, not a counter to the sea
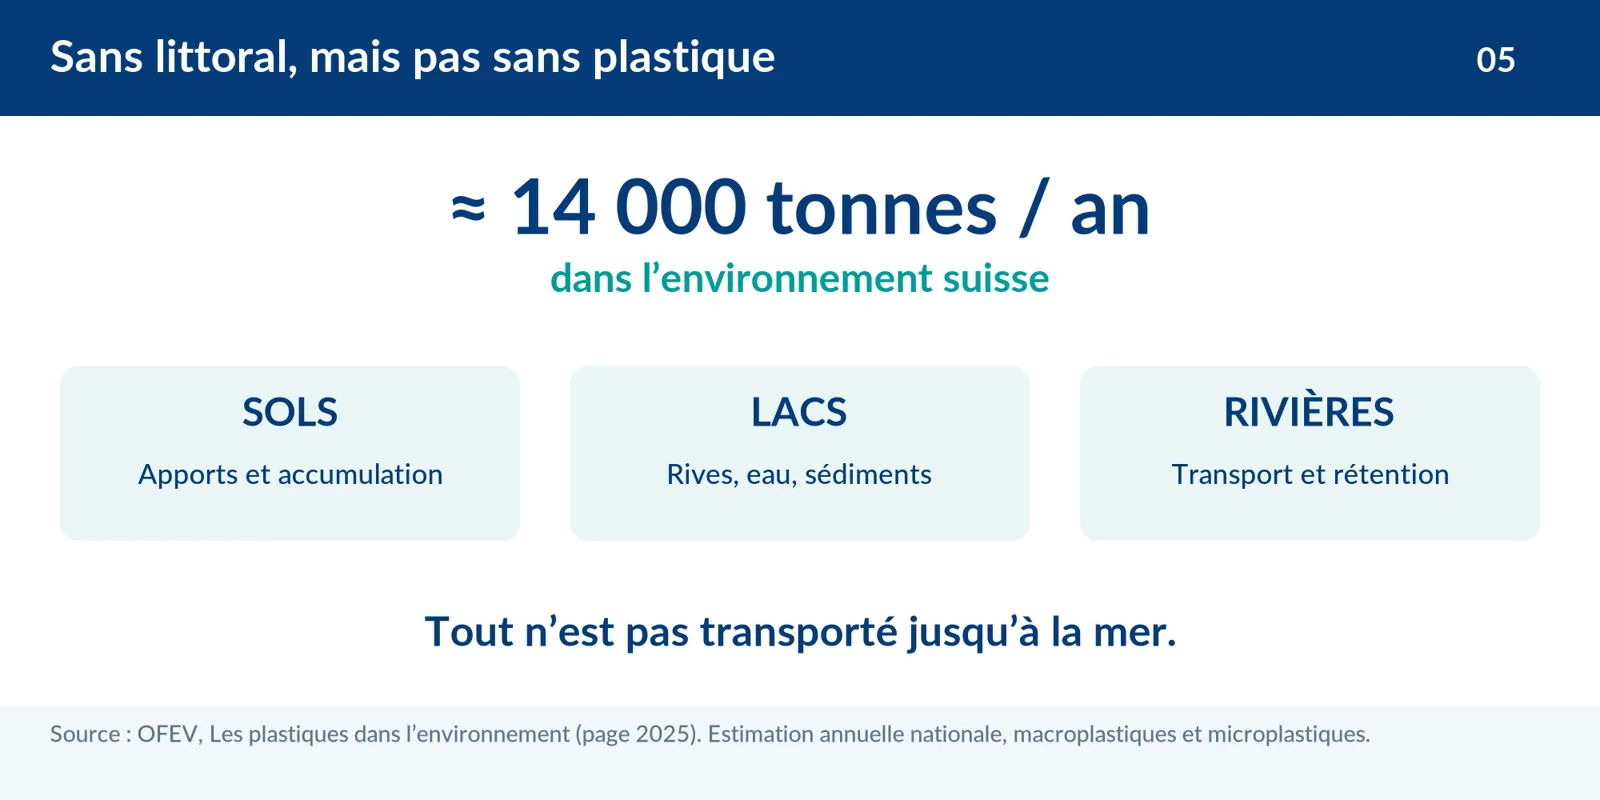
The FOEN estimates that approximately 14,000 tons of plastics, large and small, enter the Swiss environment each year. This figure covers inputs to soil and water, not 14,000 tons dumped into the ocean. [1] It is an estimate from assessment work, not the annual weighing of all waste. Keeping these 2 clarifications in mind allows for understanding the order of magnitude without making it say something else.
It's not just forgotten packaging
A significant portion of discharges comes from the wear and tear of materials, particularly tires. Littering is another source. [1] A visually clean street can therefore still be affected by particles that are difficult to see. This does not make visible waste collection useless; it shows that we must also look at transport, products, and infrastructure. The piece of plastic we pick up and the particle we avoid require different actions.
Lakes are not simple conveyor belts
Some waste or particles can be transported by waterways; others remain in the soil, on the banks, or in the sediment. It would therefore be misleading to claim that everything necessarily ends up in the sea. [1, 2] Research on Lake Geneva focuses precisely on these stocks and the distribution of plastics, particularly on beaches. [3] Preserving these environments has value in itself: a lake does not need to become a sea to deserve our attention.
Act here, cooperate elsewhere
Switzerland has waste management and water treatment systems that limit discharges without eliminating them entirely. [2] For The SeaCleaners, local and international actions complement each other. Our volunteers participate in cleanups and awareness-raising in Switzerland; our programmes in Southeast Asia respond to other contexts, with local partners. It is not a matter of choosing between one's lake and the ocean, but of linking the 2 commitments with adapted objectives.
The right reflex: participate in an organised cleanup, keep your waste until you find a suitable bin, and discuss less visible sources. The ocean is not our only horizon: the lake next door also counts.
Sources and further reading
- [1] FOEN. Plastics in the environment, page from 31.07.2025. Estimates of annual inputs in Switzerland. View ↗
- [2] FOEN. FAQ: plastics in the environment. View ↗
- [3] SIG / Association for the Safeguard of Lake Geneva. Plastic pollution of Lake Geneva: the study. Presentation of the research project. View ↗
06MICROPLASTICSDo microplastics only come from bottles that break?FALSE
The Verdict
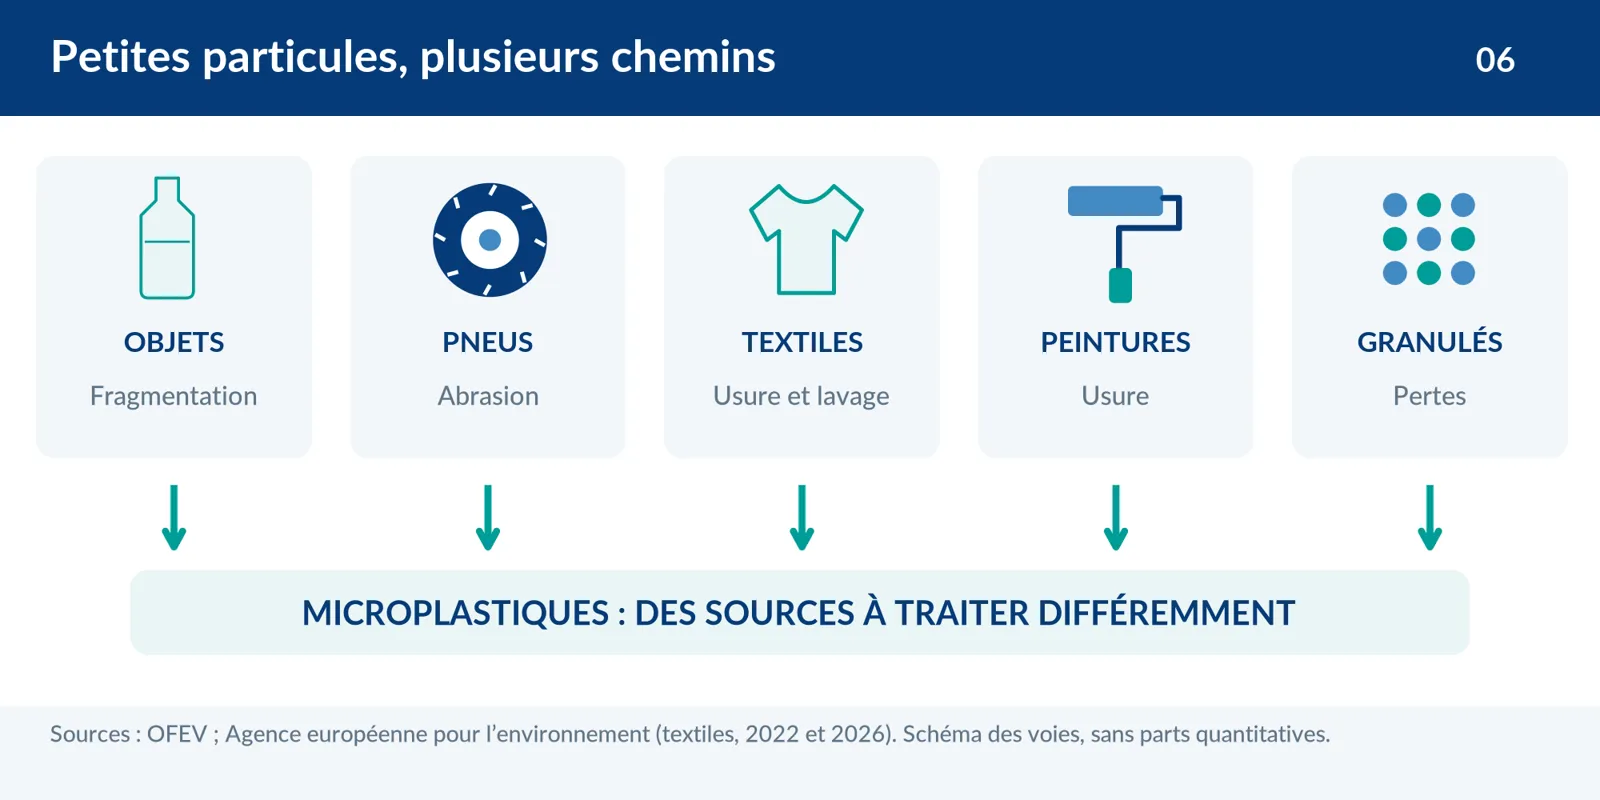
No. Fragmentation is one pathway among others: tires, textiles, paints, and pellet losses also contribute to the problem.
Reading time: approx. 3 minutes | Sources reviewed on 26.10.2026
A bottle fragmenting is easy to imagine. The small particles released by a tire or a piece of clothing are less visible. Yet, to reduce microplastics, we must look beyond the waste we hold in our hands. [1, 2]
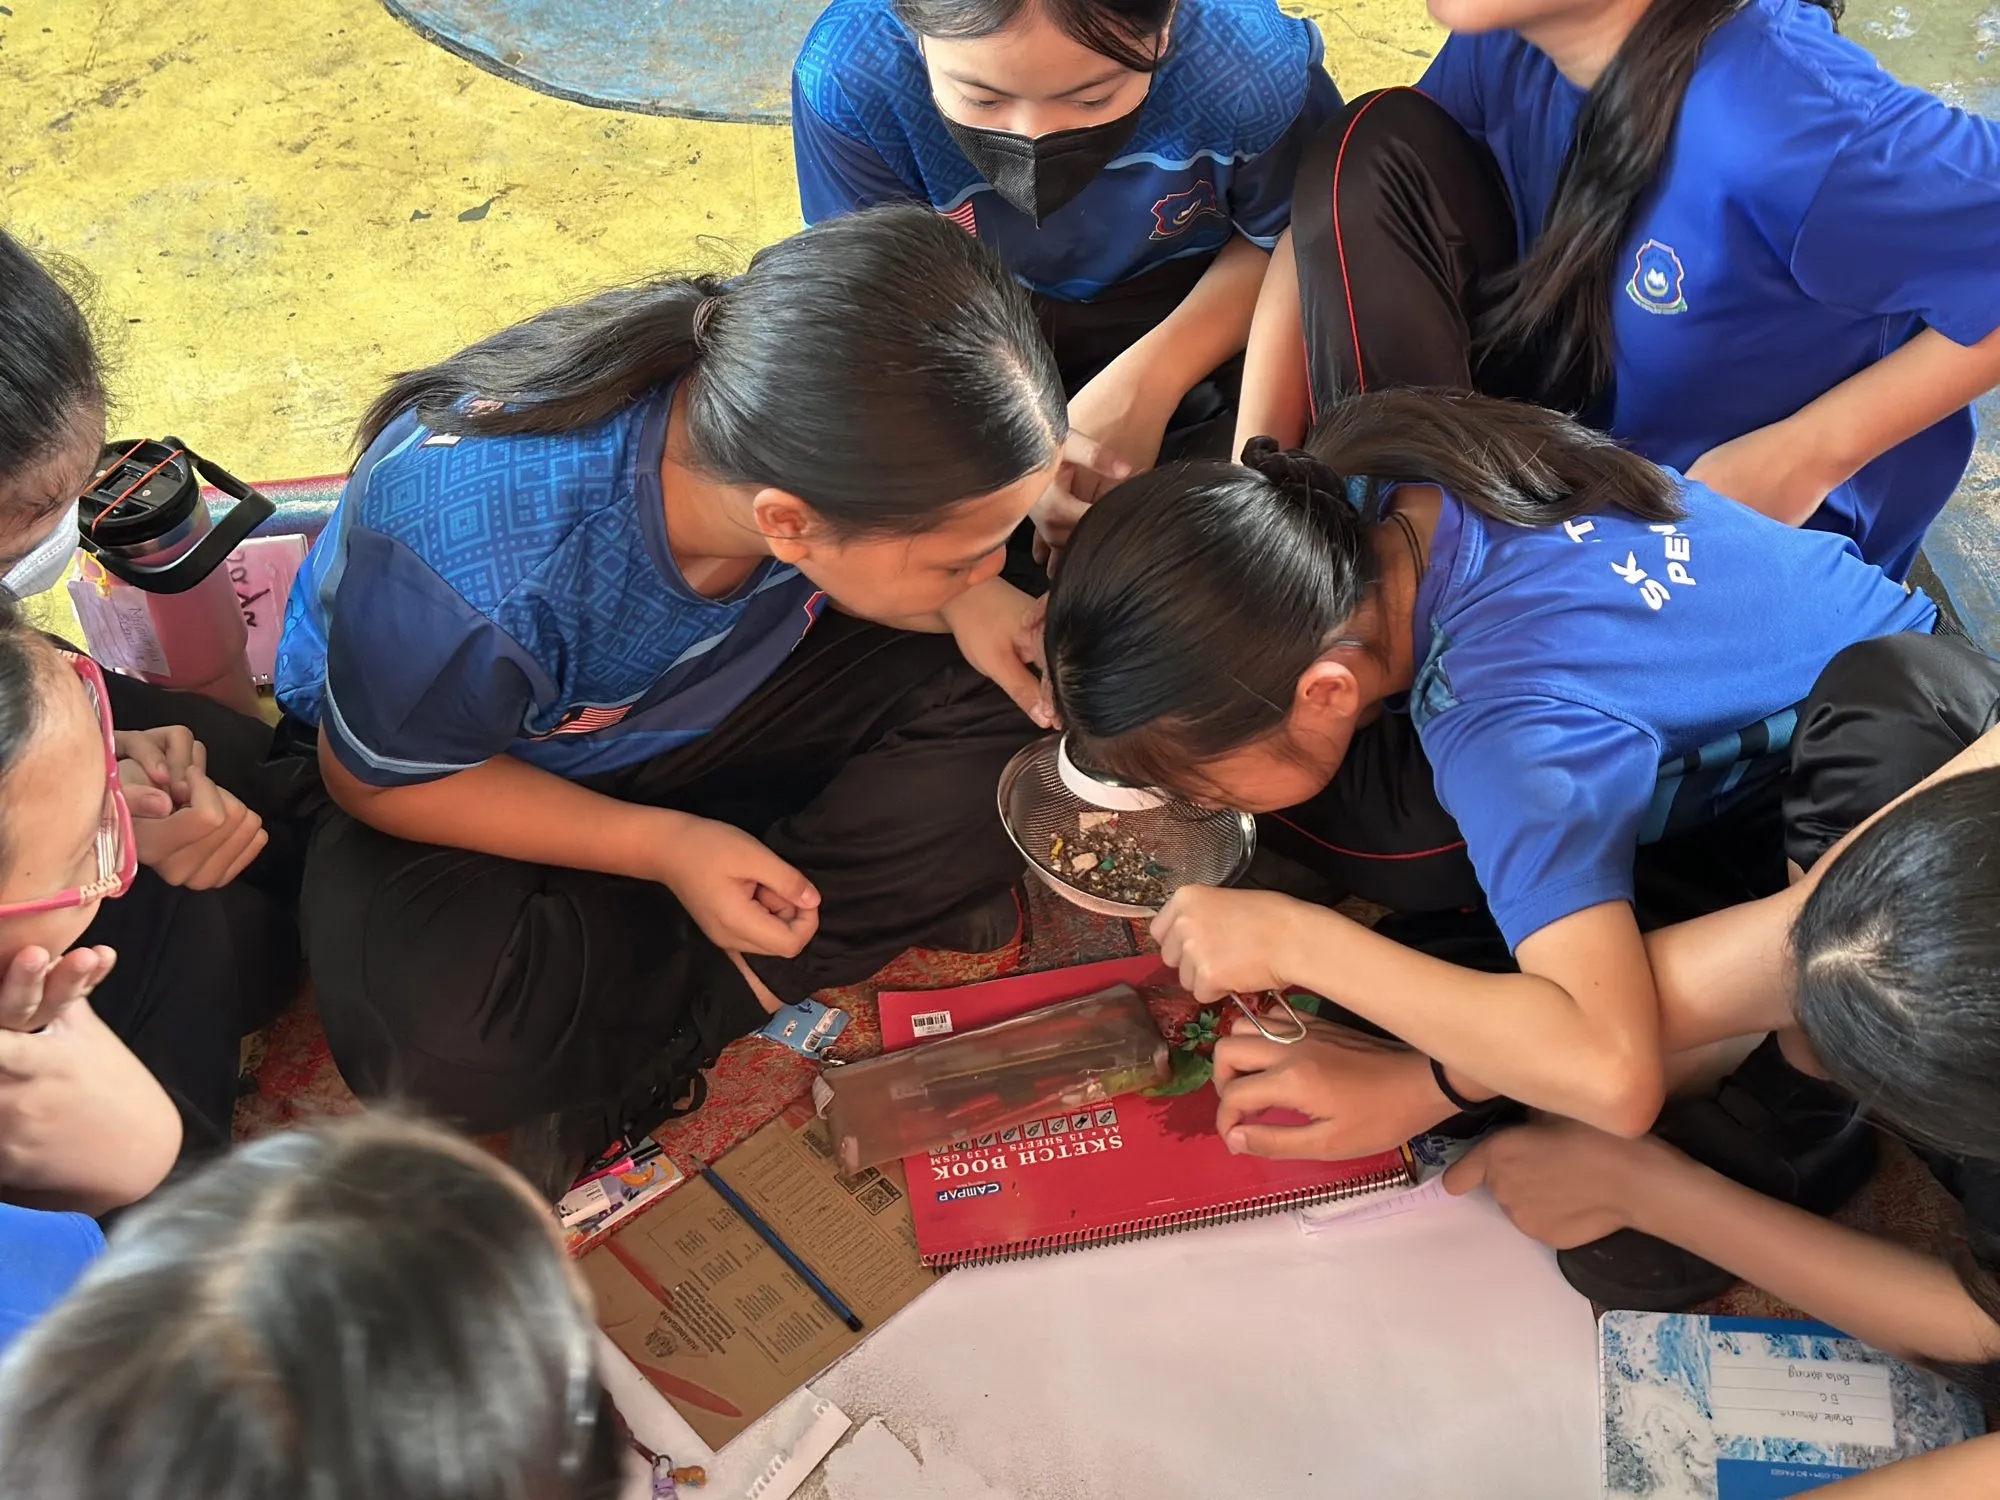
Microplastics workshop with students from St Joseph's School in Kota Kinabalu.
Small does not mean unique
Microplastics include plastic particles smaller than 5 millimetres; definitions of their lower limit vary according to scientific frameworks. It is therefore not a uniform material. A rigid fragment, a fiber, and a wear particle can have different origins and behaviours. [1] Some come from large objects that degrade; others are already small when they are released. To take action, size is not enough: the emission mode also matters.
Textiles also have their story
Synthetic textiles can release fibers during their manufacture, use, and washing. The European Environment Agency highlights that discharges depend on product characteristics and their conditions of use. [2] There is therefore no identical quantity for every wash. Estimates remain highly variable: its indicator updated in 2026 does not yet allow for a robust trend in European discharges to be identified. [3] The right message is not a magic number, but a need for better design and better measurement.
Sources that call for different responses
The FOEN identifies tire abrasion as a major source of plastic inputs to the Swiss environment. Wear particles are mixtures: we must avoid presenting their entire mass as pure polymer. [1] Paints, textiles, and industrial pellets also require measures specific to their uses. [3] Removing a floating bottle will not capture particles from a tire. Conversely, better controlling these discharges will not make already abandoned packaging disappear.
The good news: several levers, not just one
Extending the use of clothing, choosing durable products, and following adapted maintenance practices are among the levers discussed by the European Agency. They complement changes in design, manufacturing, and treatment. [2] In our awareness-raising actions, we want to make these sources understandable without placing all the responsibility on individuals. Citizens, manufacturers, local authorities, and public powers each have a place. Collecting large waste remains a useful action, but it does not constitute a universal filter for microplastics.
The right reflex: ask "where does this particle come from?" before choosing a solution. The right tool depends on the problem, not just its size.
Sources and further reading
- [1] FOEN. Plastics in the environment, page from 31.07.2025. Estimates of annual inputs in Switzerland. View ↗
- [2] European Environment Agency, 2022. Microplastics from textiles: towards a circular economy for textiles in Europe. View ↗
- [3] European Environment Agency, 2026. Microplastic from synthetic textiles unintentionally released into the environment in the EU. View ↗
07LABELSBiodegradable: can plastic just quietly disappear in the sea?NOT SO SIMPLE
The Verdict
Not necessarily. A promise of biodegradation only makes sense with a specific environment, conditions, and timeframe.
Reading time: approx. 3 minutes | Sources reviewed on 26.10.2026
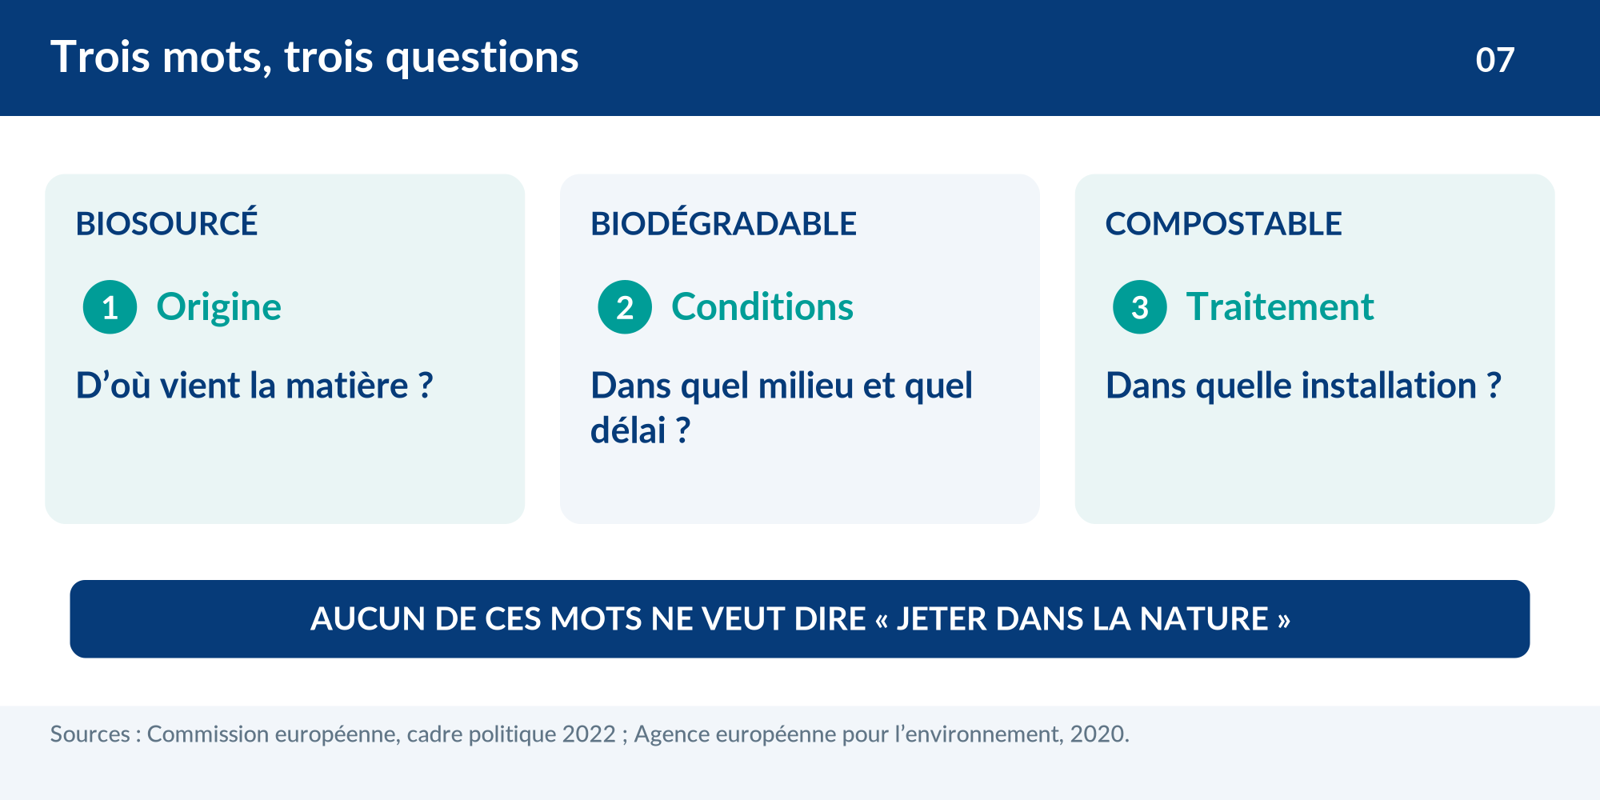
Bio-based, biodegradable, compostable: the words sound similar, but they do not answer the same question. A short guided tour of labels, so as not to confuse a useful lead with a permit to litter. [1, 2]
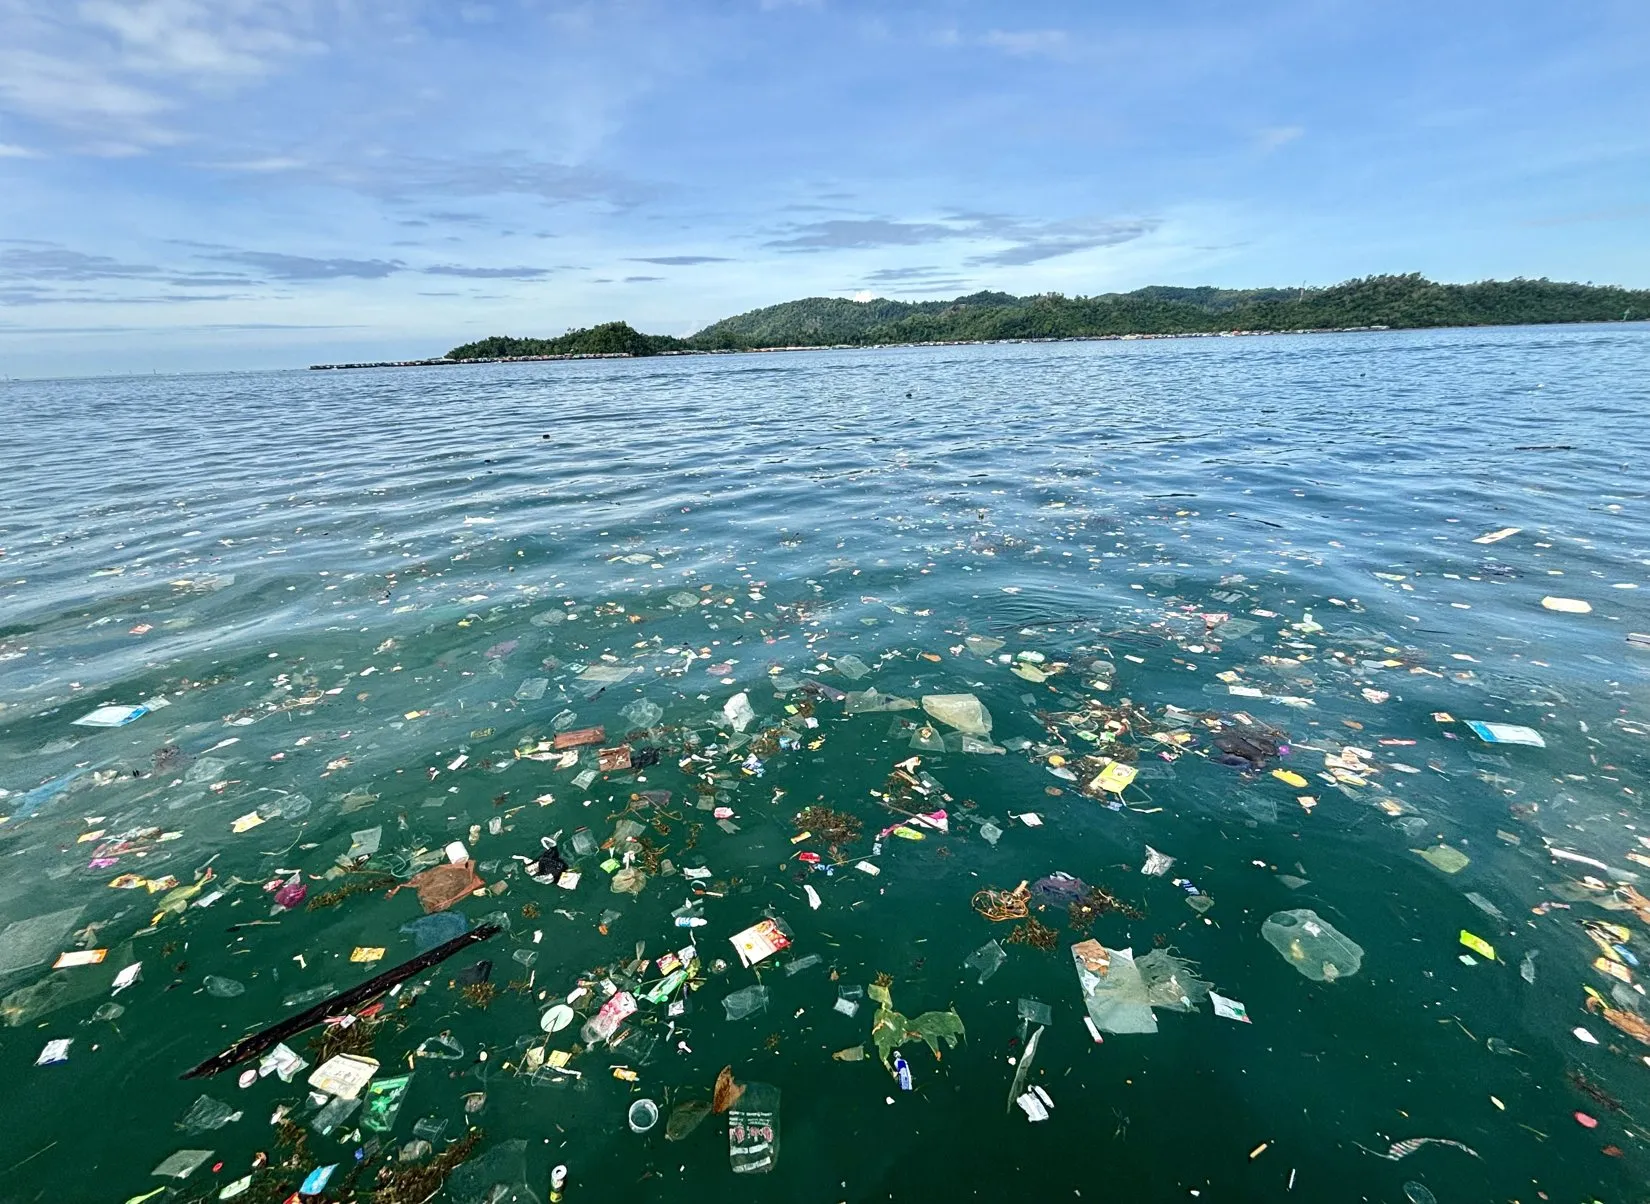
Plastic waste floating at sea, off a coast. In seawater, no packaging "quietly" disappears.
Bio-based: where does the material come from?
A bio-based plastic is made, in part or in whole, from biological resources. This tells us about its origin, not automatically about its end of life. It may or may not be biodegradable. Conversely, some fossil-based plastics are designed to biodegrade under defined conditions. [1] The word "plant-based" is therefore not enough to conclude that packaging will disappear in nature or that it will, in all cases, have a better environmental record.
Compostable: in which compost?
Industrial composting combines controlled conditions, notably temperature and humidity. Certification for this environment does not automatically apply to garden compost, soil, or seawater. The European Agency also points out that collection instructions and acceptance of these products vary by facility. [2] Before putting packaging in a bio-waste bin, it is therefore better to look at what the local system actually accepts.
The sea is not a treatment facility
In the ocean, temperature, light, and microorganism communities differ from the conditions of a composting test. Degradation rates vary greatly depending on polymers and environments. [3] A distinction must therefore be made between a property measured in a protocol and the fate of an abandoned object. "Biodegradable" means neither immediate disappearance nor absence of impact for as long as the object remains present. The intended destination of the product must remain explicit. [1, 2]
A targeted option, not a solution for everything
Compostable plastics can be of interest in certain uses linked to adapted collection and treatment. The European Commission insists on this targeted logic rather than generalised substitution. [1] Our line of reading is simple: knowing if this object is necessary, if it can be reused, and where it will go next. These questions are worth much more than a green colour on a package. In our workshops, they open up a concrete discussion, without pitting useful innovations against waste reduction.
The right reflex: look for the end-of-life instruction, not just the reassuring word. No label transforms the beach, the river, or the ocean into a trash can.
Sources and further reading
- [1] European Commission. Bio-based, biodegradable and compostable plastics; 2022 policy framework. View ↗
- [2] European Environment Agency, 2020. Biodegradable and compostable plastics: challenges and opportunities. View ↗
- [3] Chamas et al., ACS Sustainable Chemistry & Engineering, 2020, 8:3494 to 3511. Degradation Rates of Plastics in the Environment. View ↗
08SCIENCE & HEALTHDo we really swallow a credit card's worth of plastic every week?EXAGGERATED
The Verdict
This is not an established scientific average. Exposure exists, but this image gives a level of precision that the data does not support.
Reading time: approx. 3 minutes | Sources reviewed on 26.10.2026
A credit card on your plate every week: the image sticks in your mind. So, let's take the time to look at what it actually measures. On a subject that affects health, nuanced information is better than a figure that causes worry without explaining. [1, 2]
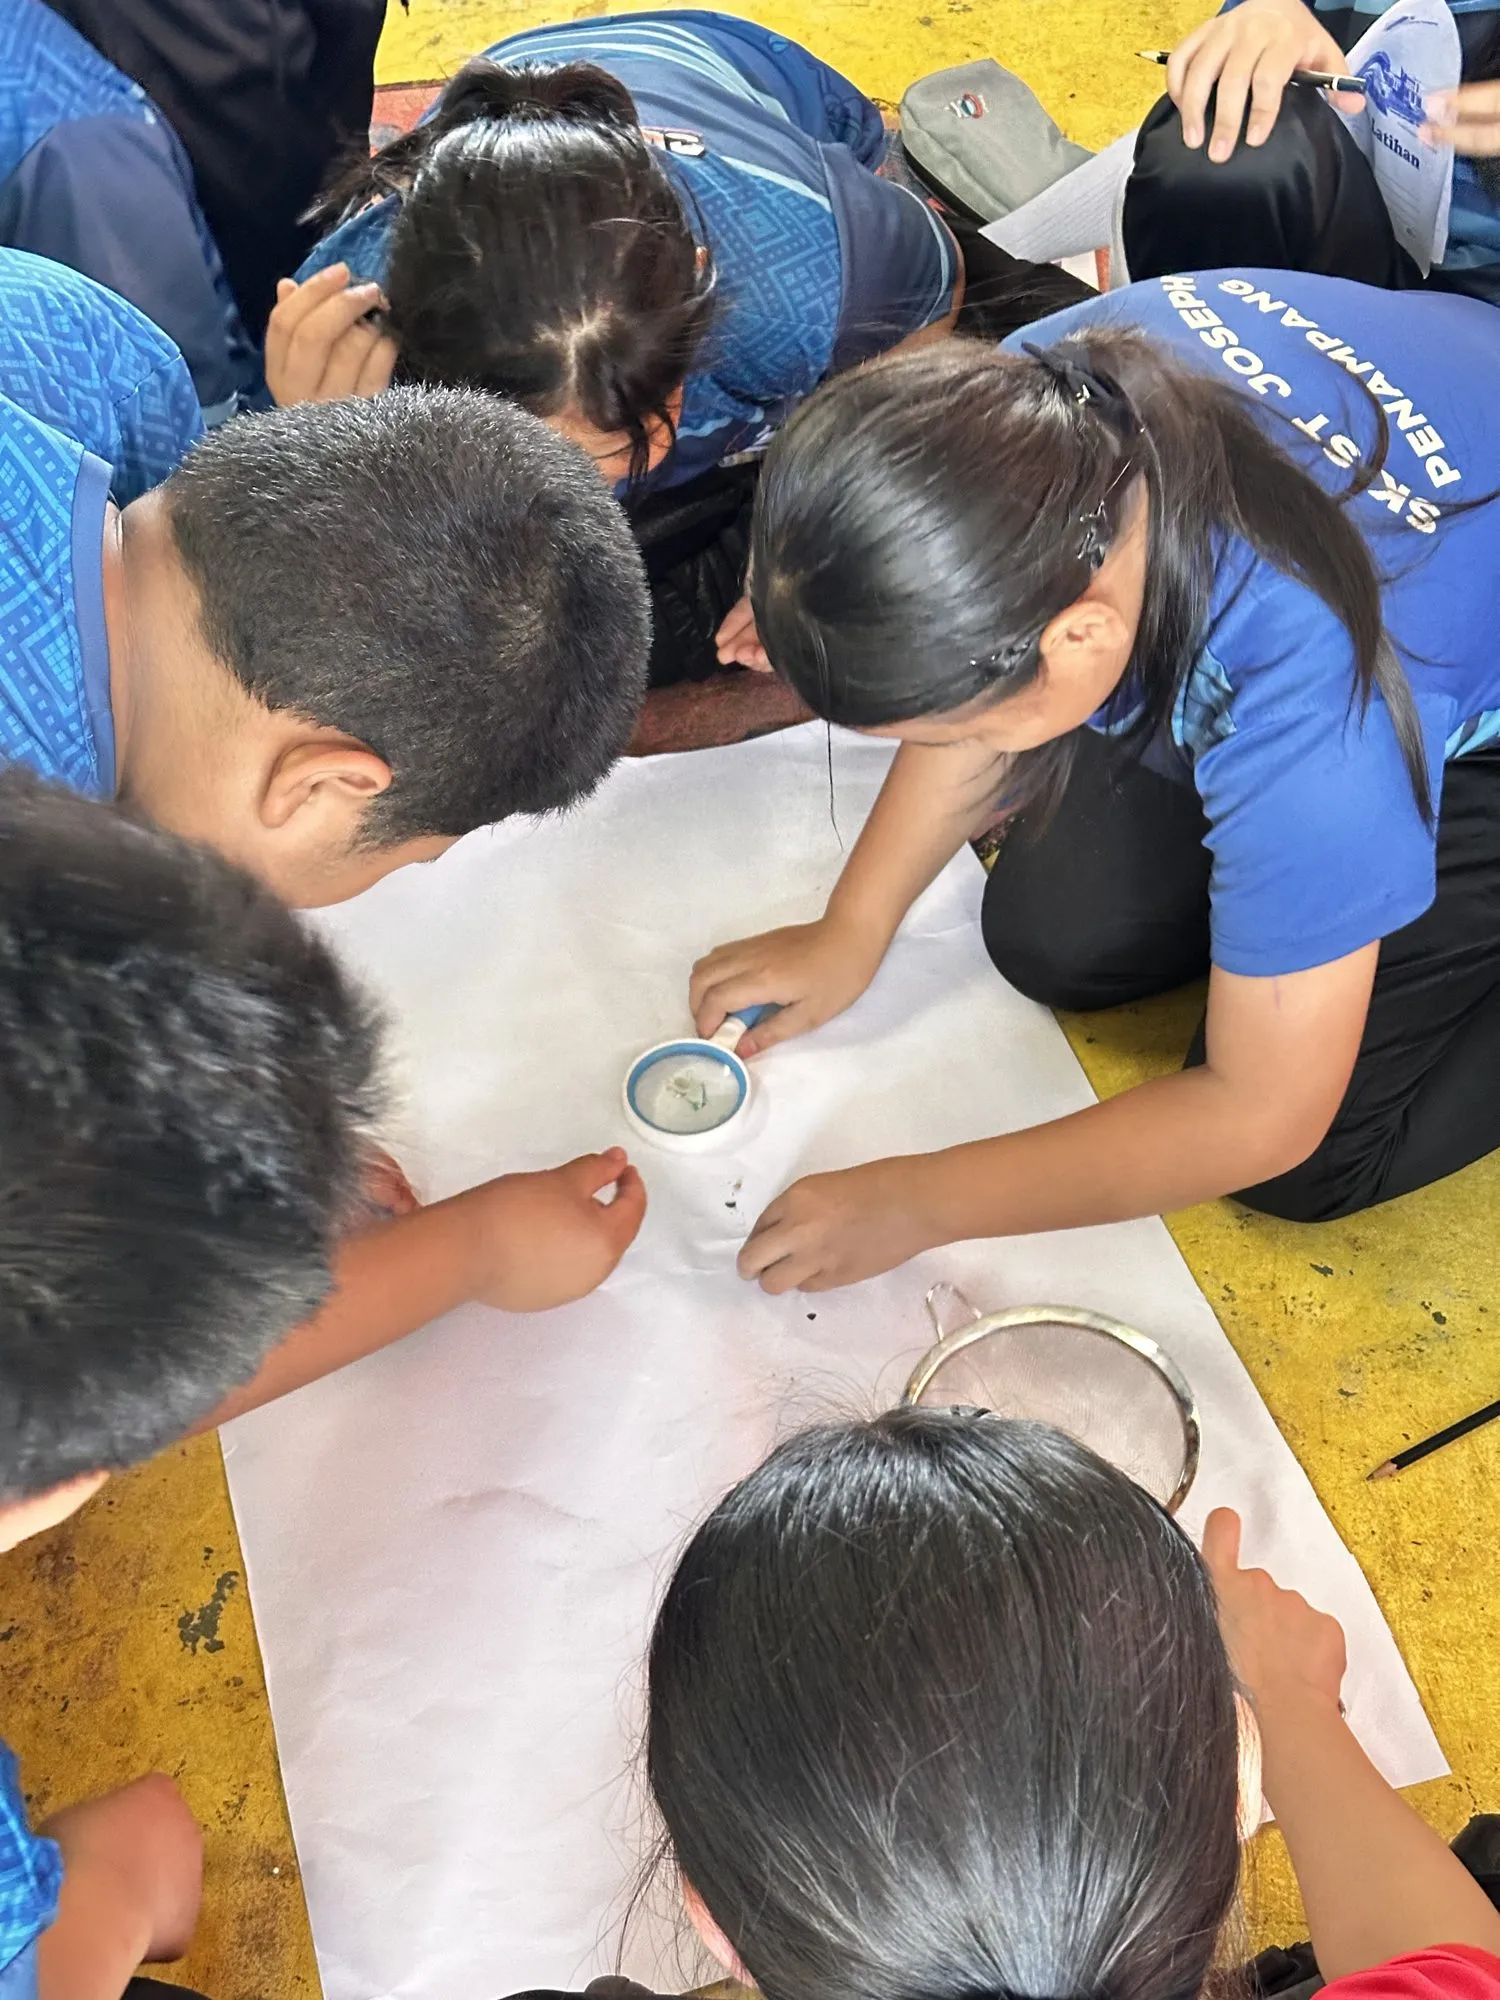
Students in Kota Kinabalu observe microplastics through a magnifying glass: an image of educational action, not a study on exposure.
Where do these 5 grams come from?
The formula is based on ingestion estimates whose upper bound reached approximately 5 grams per week. A critical analysis published in 2022 highlighted problems in conversion between particle numbers, sizes, and masses, which could produce significant overestimations. [1] This is therefore not a weighing of what each person swallows in an ordinary week. Turning a contested estimation bound into a universal ration erases the uncertainties.
No, we are not replacing it with another magic number
Results depend on the food and water analysed, consumption habits, detectable sizes, and laboratory methods. A technique that sees more small particles can give a higher number without the mass increasing in the same proportions. [1, 3] Replacing this formula with another single quantity, valid for everyone, would therefore not solve the problem. The useful observation is simpler: we do not have a sufficiently solid universal average for this formula.
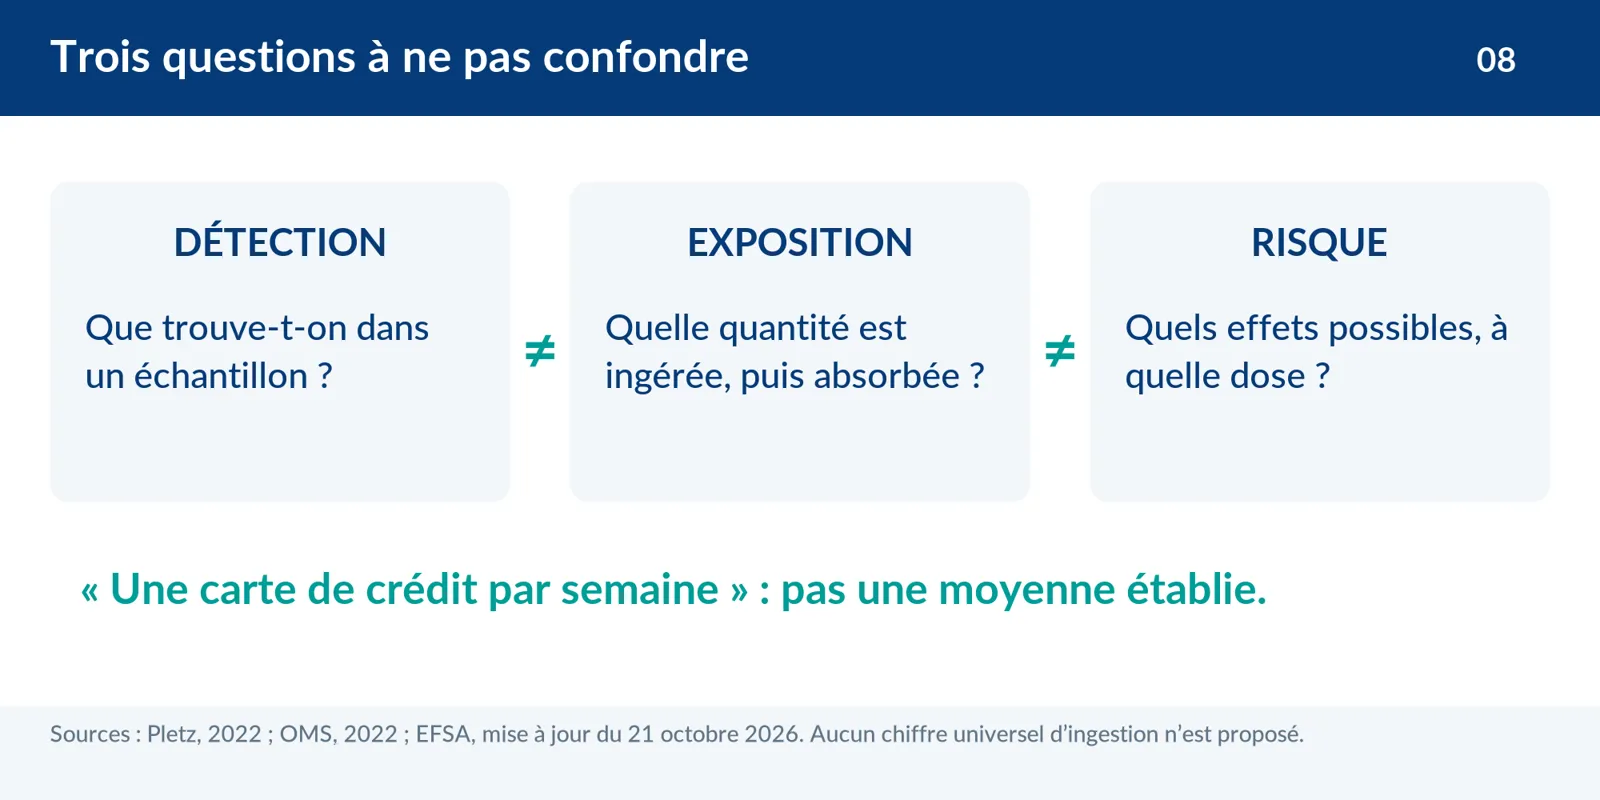
Presence, exposure, and risk are not synonyms
Detecting plastic in a food item shows presence. Evaluating what a person ingests, what their body absorbs, and the possible effects requires other information. The EFSA, in its update on 21.10.2026, still highlights the limits of knowledge on dietary exposure and health effects, particularly for nanoplastics. [2] Uncertainty proves neither safety nor illness in every exposed person. It indicates what research needs to measure better.
Taking the subject seriously, without dramatising
The WHO calls for improved methods and knowledge to assess risks. [3] The EFSA is preparing a new scientific assessment, announced for late 2027. [2] Our choice is to make these limits visible, while continuing to prevent discharges. We do not need a "credit card" to explain why plastics have no place in natural environments. Reliable communication allows for action without turning public curiosity into anxiety.
The right reflex: when faced with a spectacular health figure, look for the source, the method, and what it actually allows us to conclude. Understanding the limits of science is also a way of trusting it.
Sources and further reading
- [1] Pletz, Journal of Hazardous Materials Letters, 2022, 3:100071. Ingested microplastics: Do humans eat one credit card per week? View ↗
- [2] EFSA. Microplastics and nanoplastics in food. Update from 21.10.2026. View ↗
- [3] WHO, 2022. Dietary and inhalation exposure to nano- and microplastic particles and potential implications for human health. View ↗
09LIFESPANA bottle takes 450 years to disappear: who started the stopwatch?UNPROVEN
The Verdict
The figure is not a proven universal timeframe. And breaking down into small pieces does not mean disappearing.
Reading time: approx. 3 minutes | Sources reviewed on 26.10.2026
450 years for a bottle, 600 for a fishing line: these figures have appeared on countless posters. They give an impression of precision, but the lifespan of a plastic cannot be boiled down to a simple countdown. [1, 2]
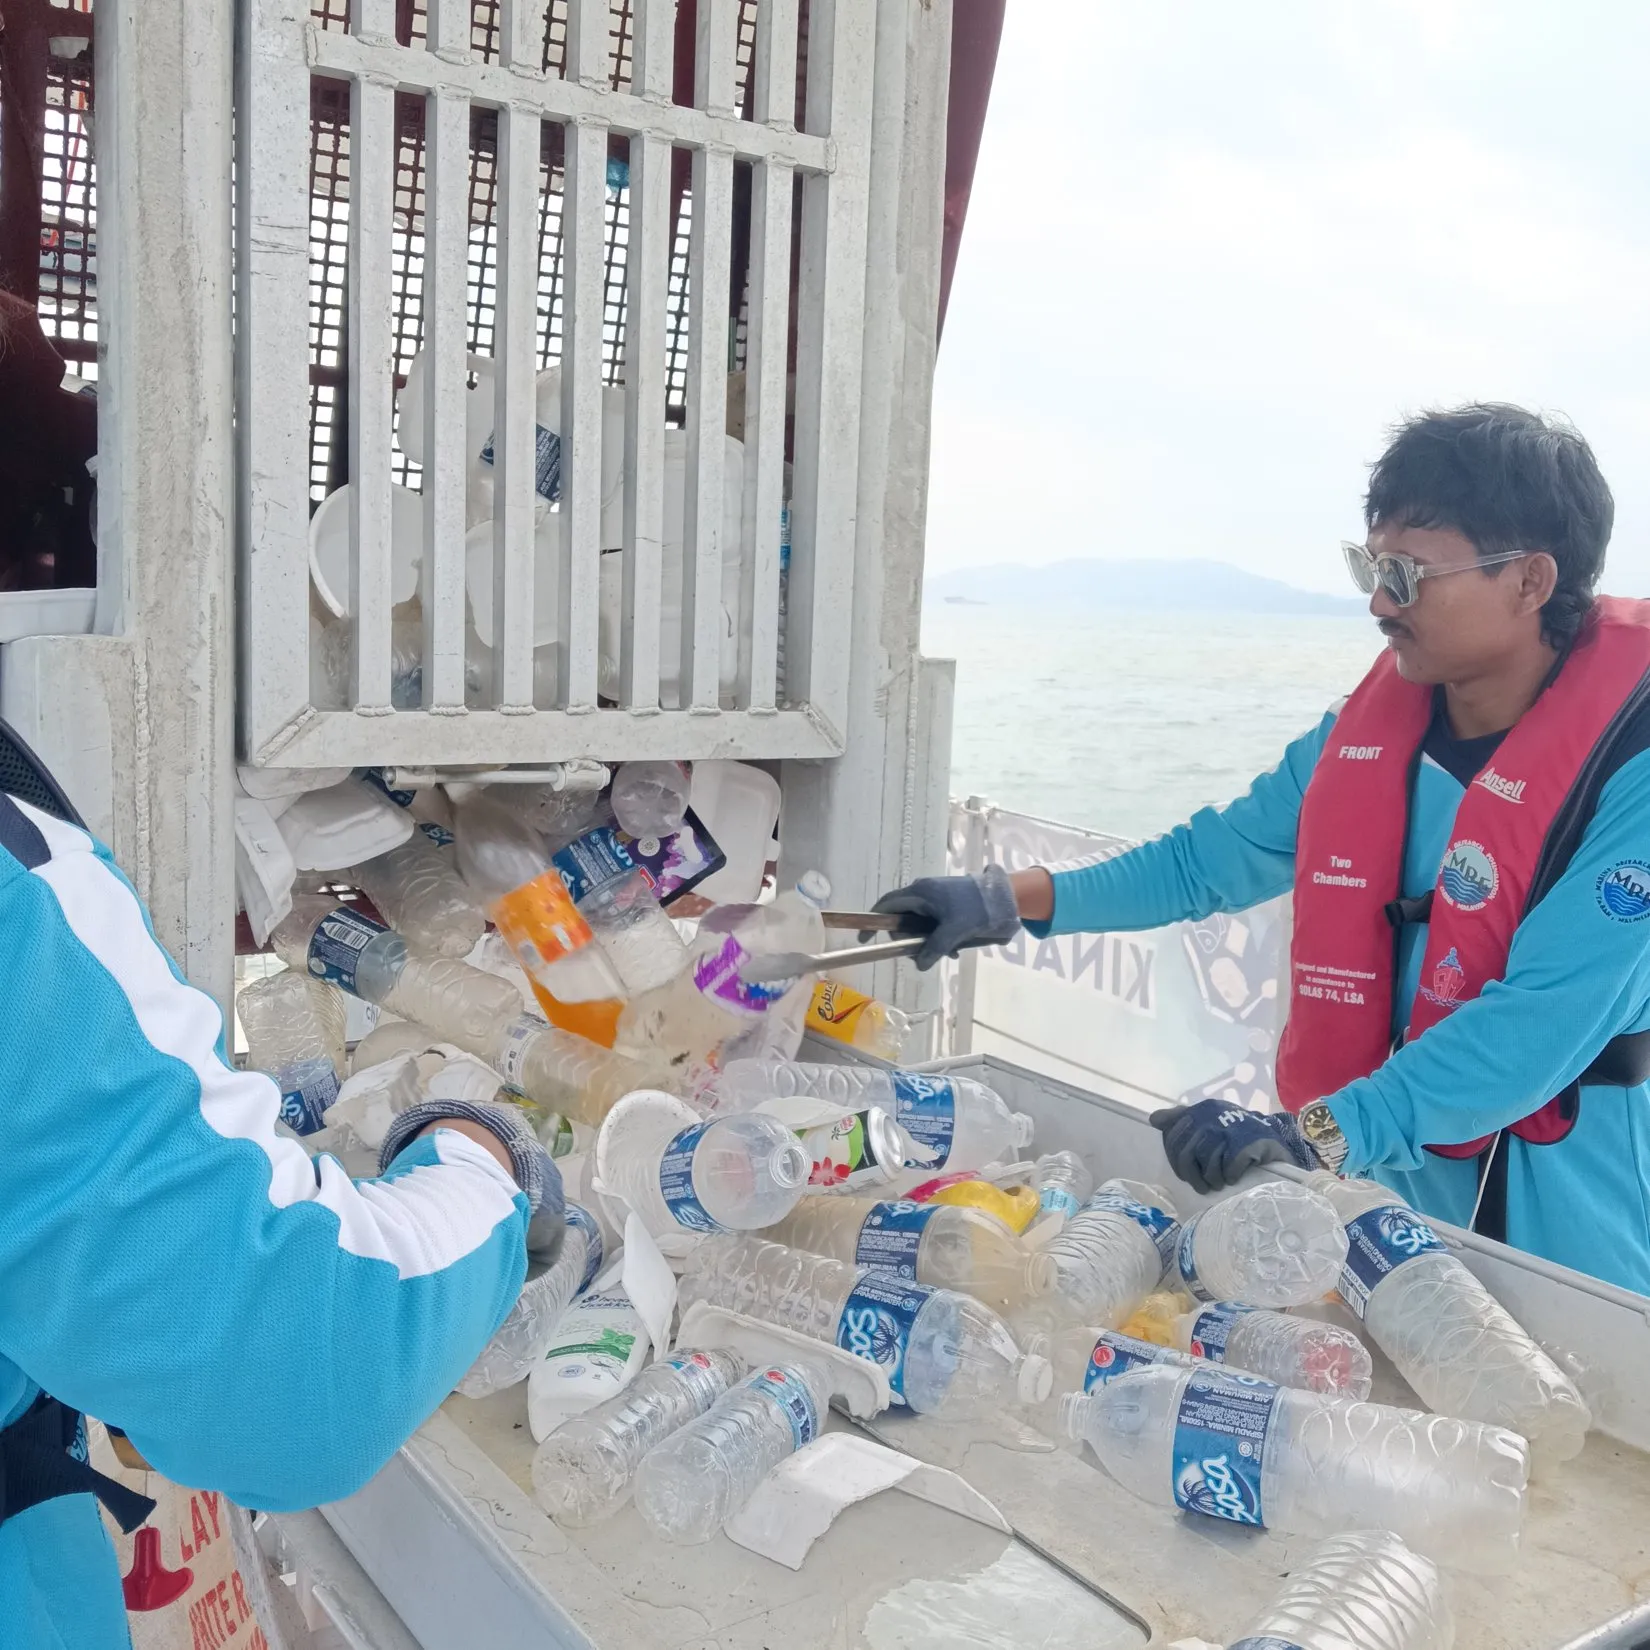
Bottles emptied from the collection basket of Mobula 8.2 in Kota Kinabalu. Their appearance does not allow determining how long they were in the water.
A Disappearance Date Without an Instruction Manual
In 2020, researchers compared the lifespans cited across numerous infographics. The review by the Woods Hole Oceanographic Institution highlights their variability and the difficulty in tracing these numbers back to verifiable scientific foundations. [1] This does not mean that research on plastic degradation does not exist. It means that a single duration, applied without specifying the object and its surrounding environment, does not constitute a reliable metric.
Same Material, Different Fates
Polymer composition, additives, thickness, and environmental conditions all influence degradation. An item exposed to sunlight does not necessarily follow the same pathway as an object that is buried, submerged at great depths, or exposed to different temperatures. The scientific review published in 2020 in ACS Sustainable Chemistry & Engineering demonstrates how widely degradation rates vary depending on materials and conditions. [2] Providing a timeframe without this context is like giving a travel time without naming the route.
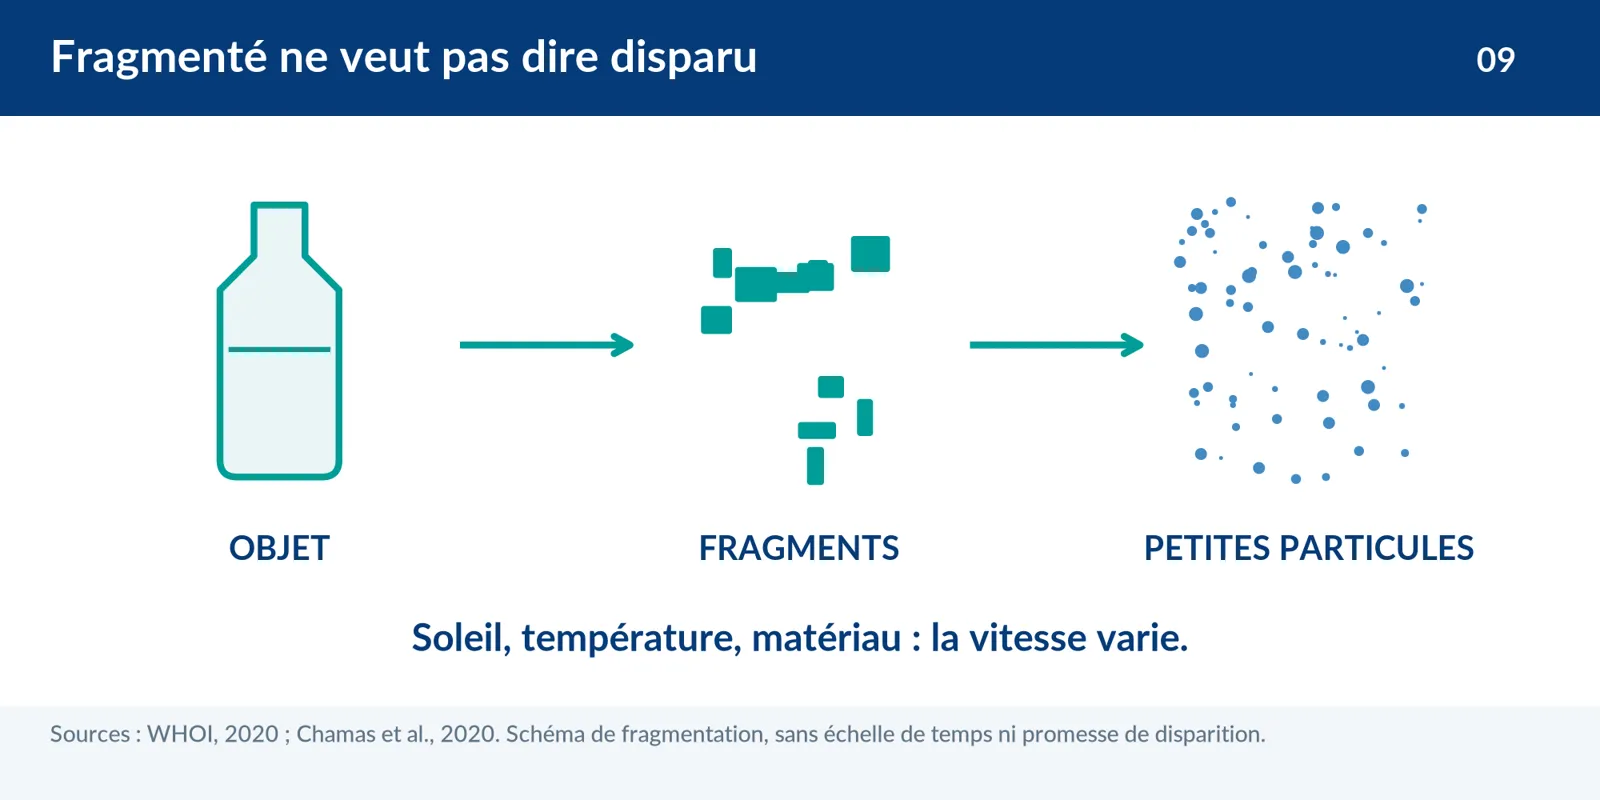
Smaller Does Not Mean Gone
An item can lose its recognisable shape by fragmenting, while plastic material remains in the form of small particles. This physical fragmentation must be distinguished from chemical transformation or complete biodegradation. [2, 3] The fact that a bottle is no longer visible does not prove that its material has left the environment. The meaningful question is not merely "how long does this item remain visible?" but also "what happens to this item over that time?"
No Need to Wait 450 Years to Take Action
We propose replacing the countdown timer with a more robust message: curtail waste inputs and recover accessible debris before it becomes harder to retrieve. Persistence varies, but it should never serve as waste management guidance. [3] Our cleanup operations focus on tangible waste, followed by sorting and routing towards available processing streams. A collected item is not automatically recyclable: it still requires proper waste processing. Progress is measured through these actions, not by an imaginary countdown.
The right approach: discuss persistence and fragmentation rather than promising an exact date of disappearance. The best place for an object to reach its end of life remains an appropriate waste management facility, not nature.
Sources and further reading
- [1] Woods Hole Oceanographic Institution, 15.06.2020. The many lifetimes of plastics. View ↗
- [2] Chamas et al., ACS Sustainable Chemistry & Engineering, 2020, 8:3494–3511. Degradation Rates of Plastics in the Environment. View ↗
- [3] Woods Hole Oceanographic Institution, 02.09.2020. How long does plastic persist in the ocean? View ↗
10SHARED RESPONSIBILITYDoes our plastic waste travel from Europe to Asia?IT’S COMPLICATED
The Verdict
Yes, a portion has been exported to Southeast Asia. However, not all waste streams are identical, illegal, or destined for this region.
Reading time: approx. 3 minutes | Sources reviewed on 26.10.2026
A piece of packaging's journey does not always end at the sorting facility. Plastic waste is traded internationally. To understand the dynamics at play, let us trace the material without confusing regulated recycling with shifting pollution elsewhere. [1]
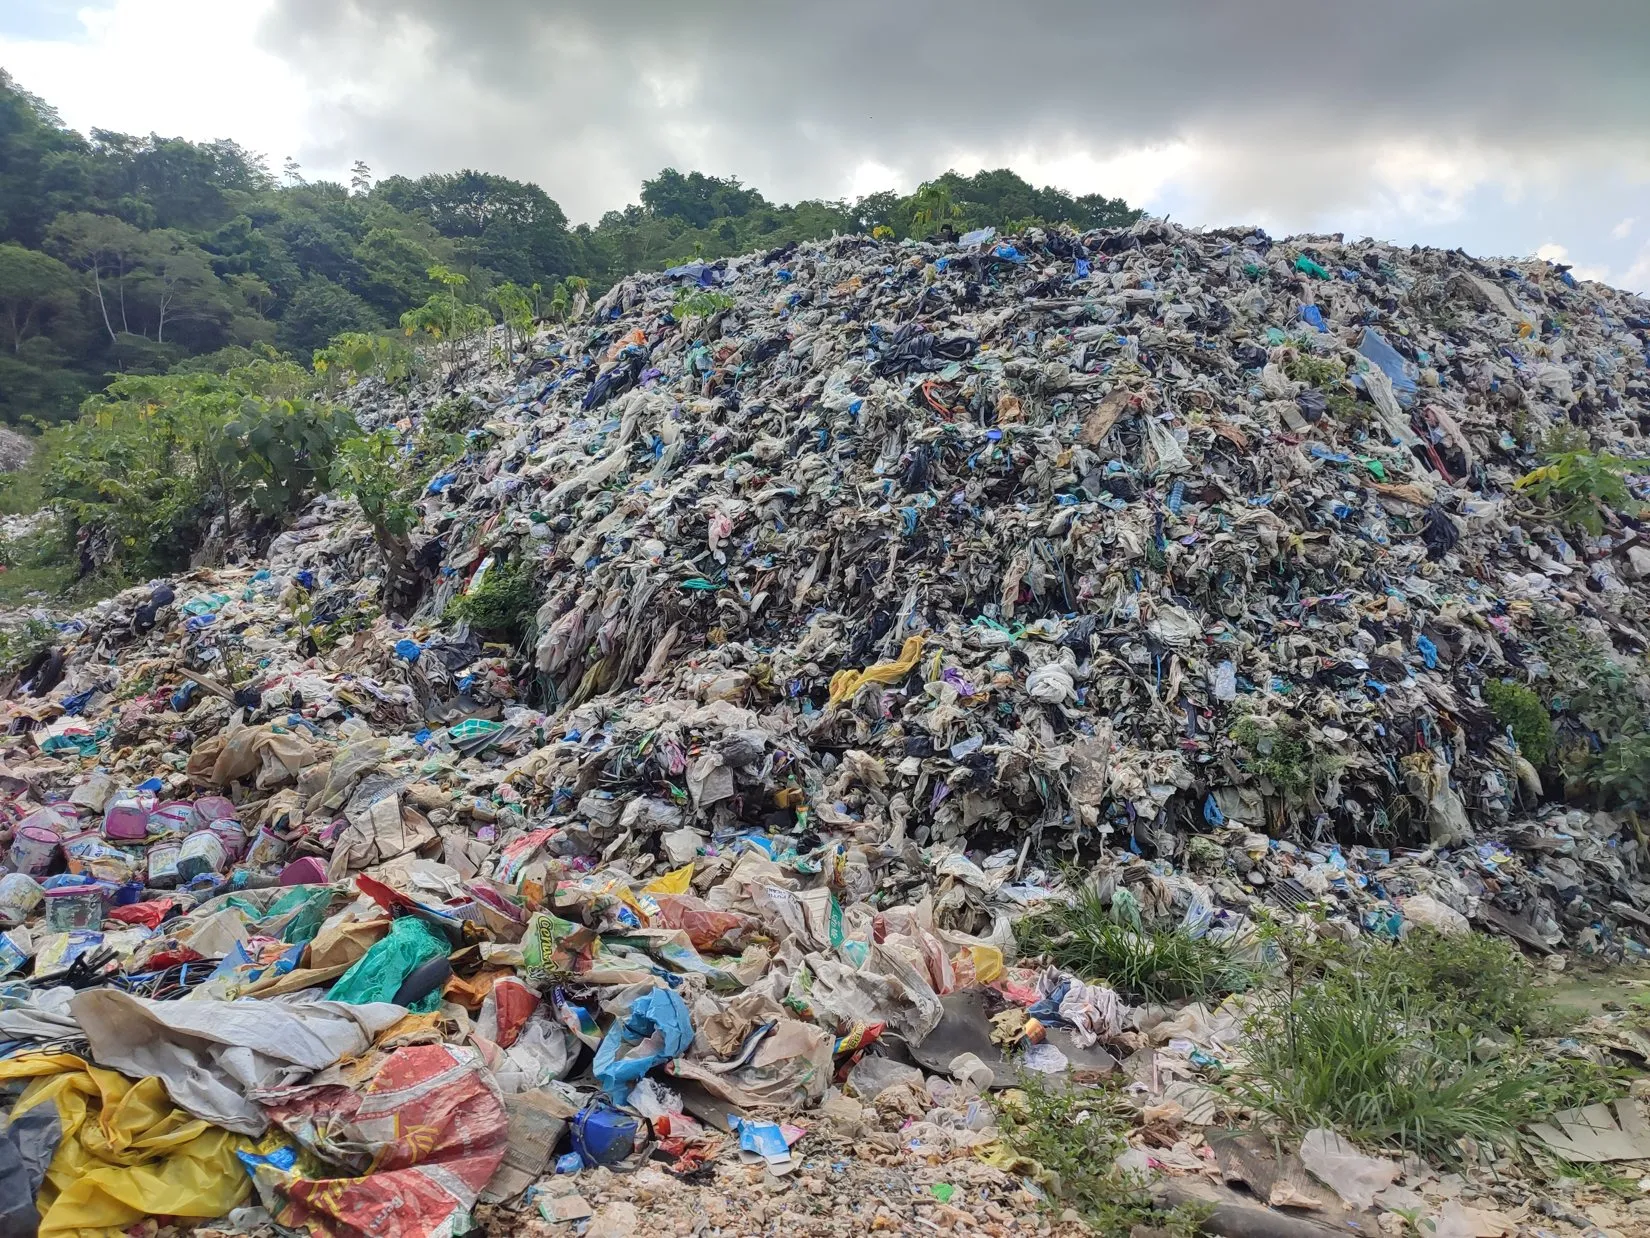
An open dumpsite. This image does not allow determining the origin of the waste.
A Real Trade, Vastly Different Situations
A clean, sorted shipment can serve as raw material for a recycler. A contaminated load, one that is misdeclared, or one sent to an inadequate facility raises an entirely different issue. The OECD underscores both the potential value of trade for recycling and the risks when treatment capacity is lacking. [1] The word "recycling" on documentation is therefore not enough: the quality of the batch, its traceability, and its actual processing are what count.
Southeast Asia, but Not Exclusively
The 2024 monitoring report published by the OECD shows that several countries in Southeast Asia remain major destinations, while trade among OECD member states is taking on greater significance. [2] For the European Union, the Commission estimates exports to third countries at approximately 1.4 million metric tons in 2025; Türkiye receives around 510,000 metric tons, or 36%. [3] Reducing all waste flows to "Europe to Asia" overlooks a far more complex reality. Furthermore, the European Union does not represent all of Europe: Switzerland is not a member.
Regulatory Changes Underway
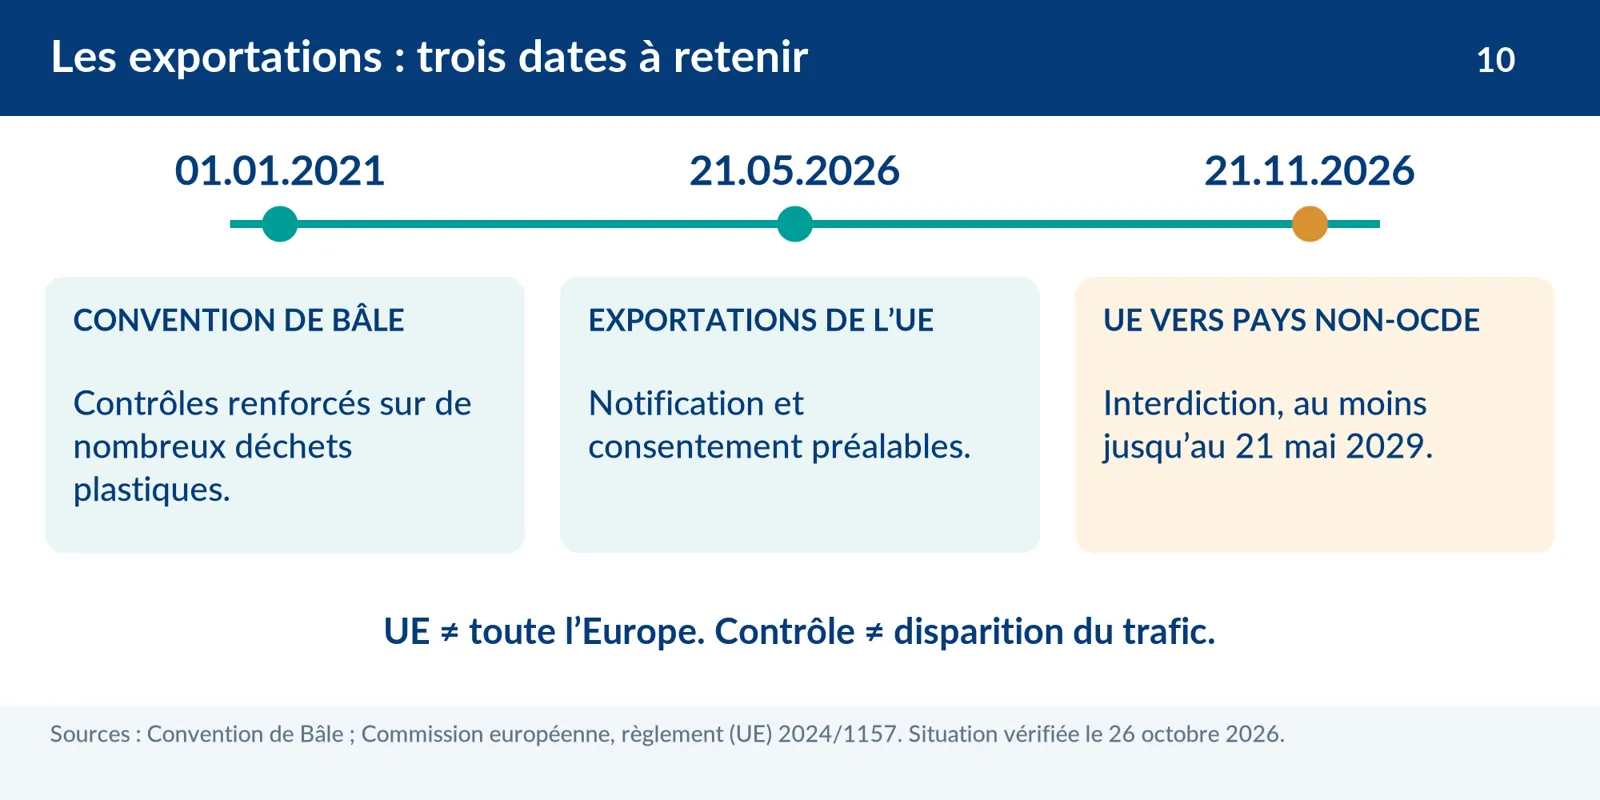
Since 01.01.2021, the Basel Convention Plastic Waste Amendments have tightened controls on many plastic waste streams; this does not constitute a global ban on all trade. [4] Within the European Union, prior notification and consent have applied to plastic waste exports since 21.05.2026. The export ban to non-OECD countries is set to take effect on 21.11.2026, lasting at least until 21.05.2029. As of 26.10.2026, this final milestone remains upcoming. [5]
Sharing Responsibility, Not Blame
Debris observed in Ambon or Kota Kinabalu cannot be attributed to European exports without a traceability investigation. A photograph or a brand name is not enough to reconstruct its journey. Our position is that the burden of responsibility should not fall solely on the local populations where waste accumulates. Design, consumption, collection, and trade must be addressed holistically. Local cooperation remains essential, but it cannot substitute for the accountability of stakeholders who bring products and materials into circulation.
The right approach: ask "where does the material go and how is it processed?" rather than stopping at the word "collected." A transparent supply chain should be able to account for its journey.
Sources and further reading
- [1] OECD, 2022. Monitoring trade in plastic waste and scrap.
- [2] OECD, 2024. Monitoring trade in plastic waste and scrap 2024. Analysis of flows from 2017 to 2022. View ↗
- [3] European Commission, 01.09.2026. Assessment of the sustainability of plastic waste exports to OECD countries, SWD(2026) 274 final. 2025 trade data. View ↗
- [4] Basel Convention. Plastic Waste Amendments: Frequently Asked Questions. Amendments effective since 01.01.2021. View ↗
- [5] European Commission. Plastic waste shipments. Regulation (EU) 2024/1157 implementation timeline, accessed 26.10.2026. View ↗
11CLIMATEDoes plastic pollute more than flying?IT’S COMPLICATED
The Verdict
Frequently compared figures do not cover the same impacts. They point to a significant climate challenge, not a single winner across all categories.
Reading time: approx. 3 minutes | Sources reviewed on 26.10.2026
An airplane in the sky, a bottle in hand: the connection is not obvious. Yet the lifecycle of plastic also generates greenhouse gas emissions. Let us compare orders of magnitude, but with proper classifications. [1, 2]
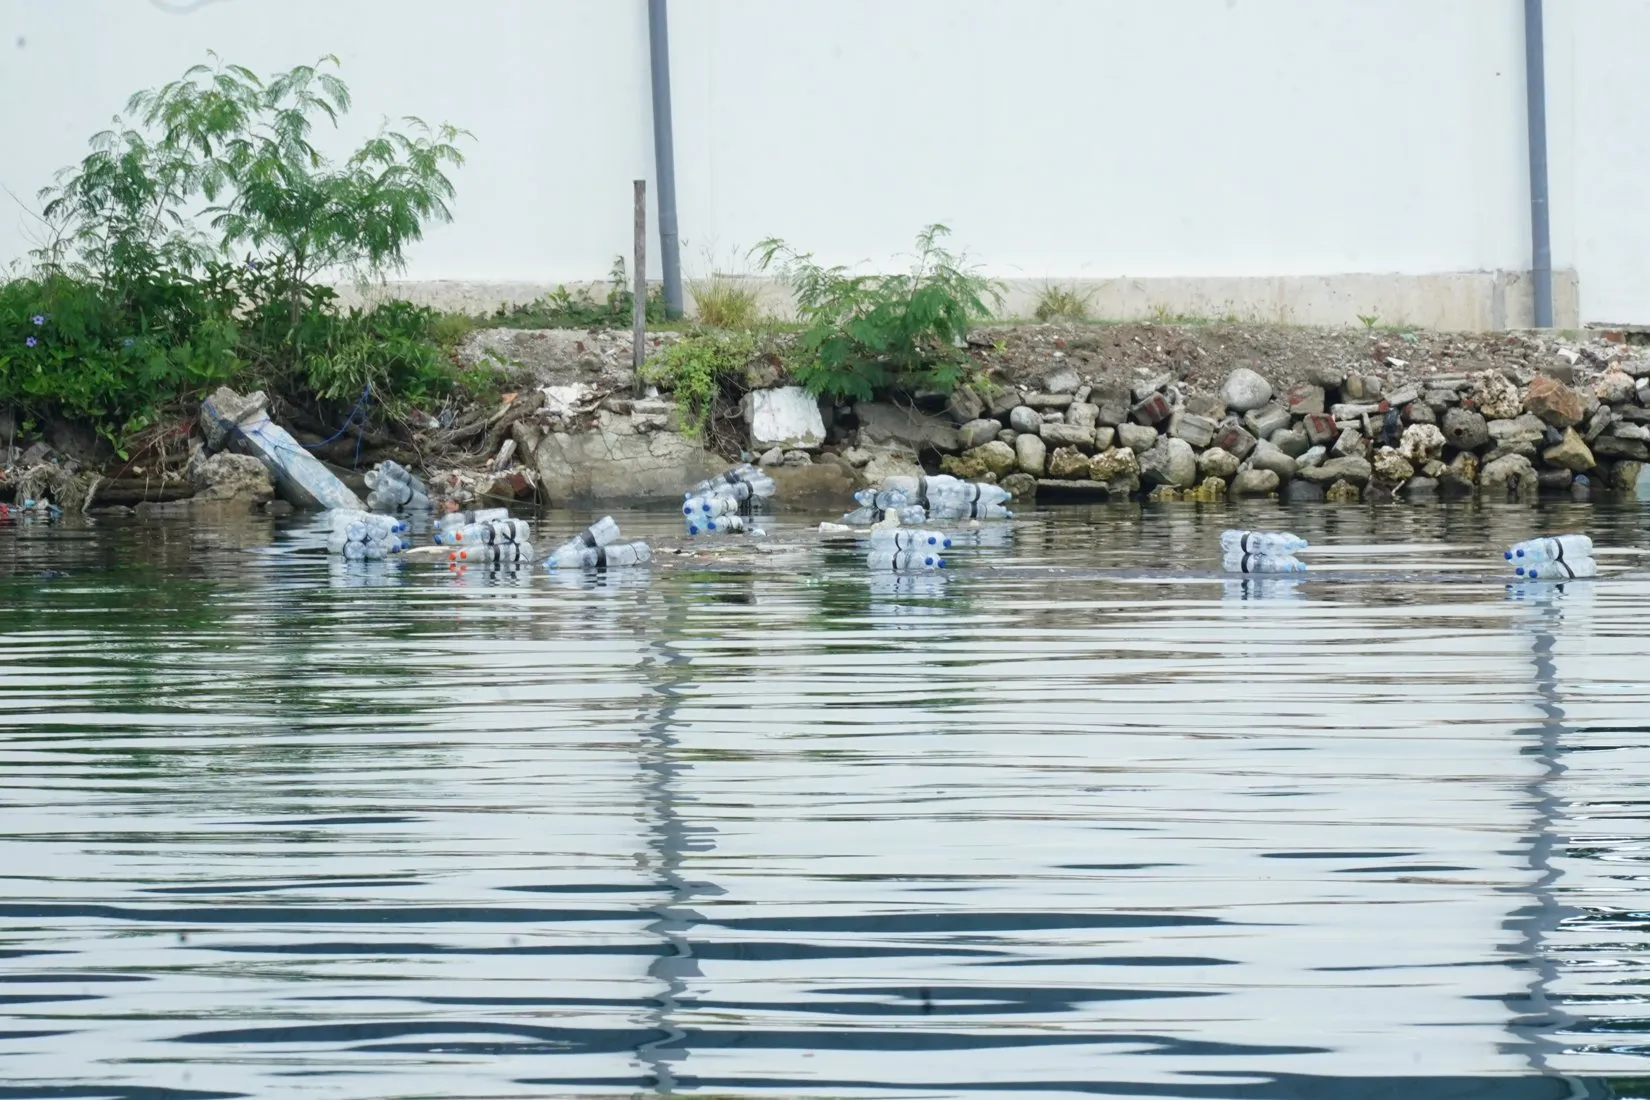
Plastic bottles floating along a shoreline. Collecting this waste does not, on its own, constitute a carbon footprint assessment.
First, What Does "Polluting" Mean?
Climate change, water pollution, impacts on ecosystems, and air quality cannot be captured by a single metric. Here, we examine global annual climate emissions, not all environmental impacts, and not an individual's footprint. The scope of activities included must also be clearly defined. A life cycle assessment examines multiple stages, from production through end of life; an aviation inventory may only measure operational flight emissions. [1, 2]
Two Figures for the Same Year, but Different Scopes
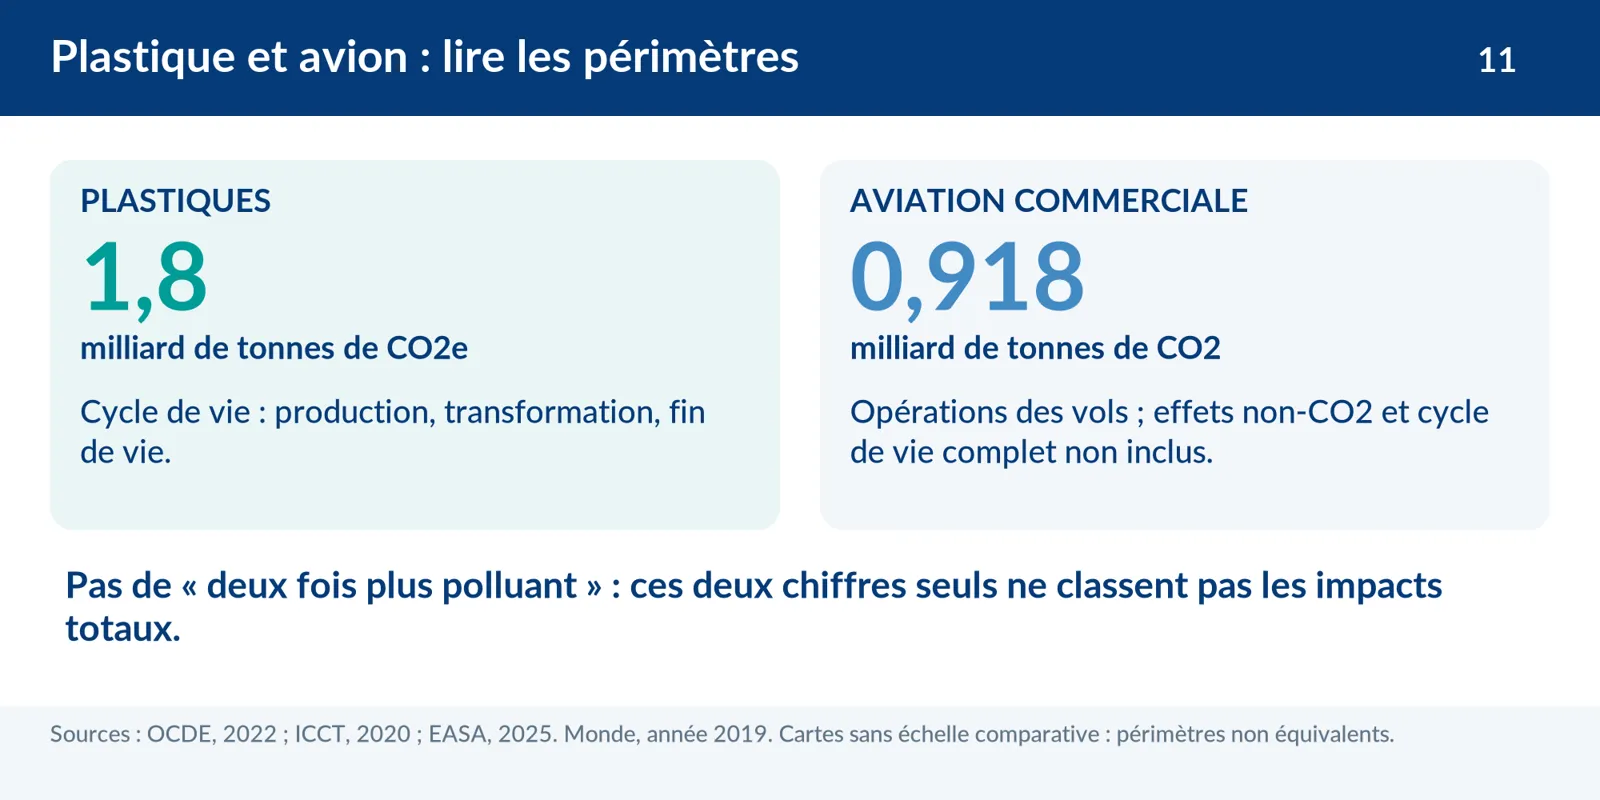
For 2019, the OECD estimates the life-cycle emissions of plastics at 1.8 billion metric tons of CO2 equivalent, representing 3.4% of global greenhouse gas emissions. Approximately 90% arise from production and conversion. [1] For that same year, the ICCT estimates CO2 emissions from commercial aviation operations at 918 million metric tons. [2] While numerically lower, this second figure includes neither the full life cycle of the aviation sector nor all of its climate impacts.
What the Direct Comparison Overlooks at High Altitude
Aviation also impacts the climate through effects other than CO2, notably those linked to nitrogen oxides and contrail cirrus. EASA highlights both their significance and the uncertainties associated with quantifying them. [3] Stating that "plastic pollutes twice as much as flying" based solely on the preceding numbers would therefore be misleading. A comprehensive comparison would require harmonised scopes, a shared climate metric, and an explicit time horizon. Percentages of global CO2 and percentages of total greenhouse gas emissions are not interchangeable.
The Practical Takeaway: Plastic Is Also a Climate Issue
It is not necessary to declare a winner to recognise the importance of both issues. For plastics, addressing non-essential uses, reuse, and manufacturing complements work done at the end-of-life stage. [1] For The SeaCleaners, collecting waste serves primarily to prevent environmental pollution. We do not present a collected kilogram as an automatic quantity of avoided CO2, nor as an offset for an airplane flight. Each result must retain its specific unit and calculation method.
The right approach: when looking at comparisons, verify the year, the unit, and the scope. The right question is not "which one gives us permission to ignore the other?" but "where can we take action?"
Sources and further reading
- [1] OECD, 2022. Global Plastics Outlook, Chapter 2. Global data for 2019. View ↗
- [2] ICCT, 2020. CO2 emissions from commercial aviation: 2013, 2018, and 2019. Global operational emissions from commercial aviation. View ↗
- [3] EASA, 2025. European Aviation Environmental Report 2025: CO2 and non-CO2 climate impacts of aviation. View ↗
12SOLUTIONSReduce or clean up: is a choice really necessary?COMPLEMENTARY
The Verdict
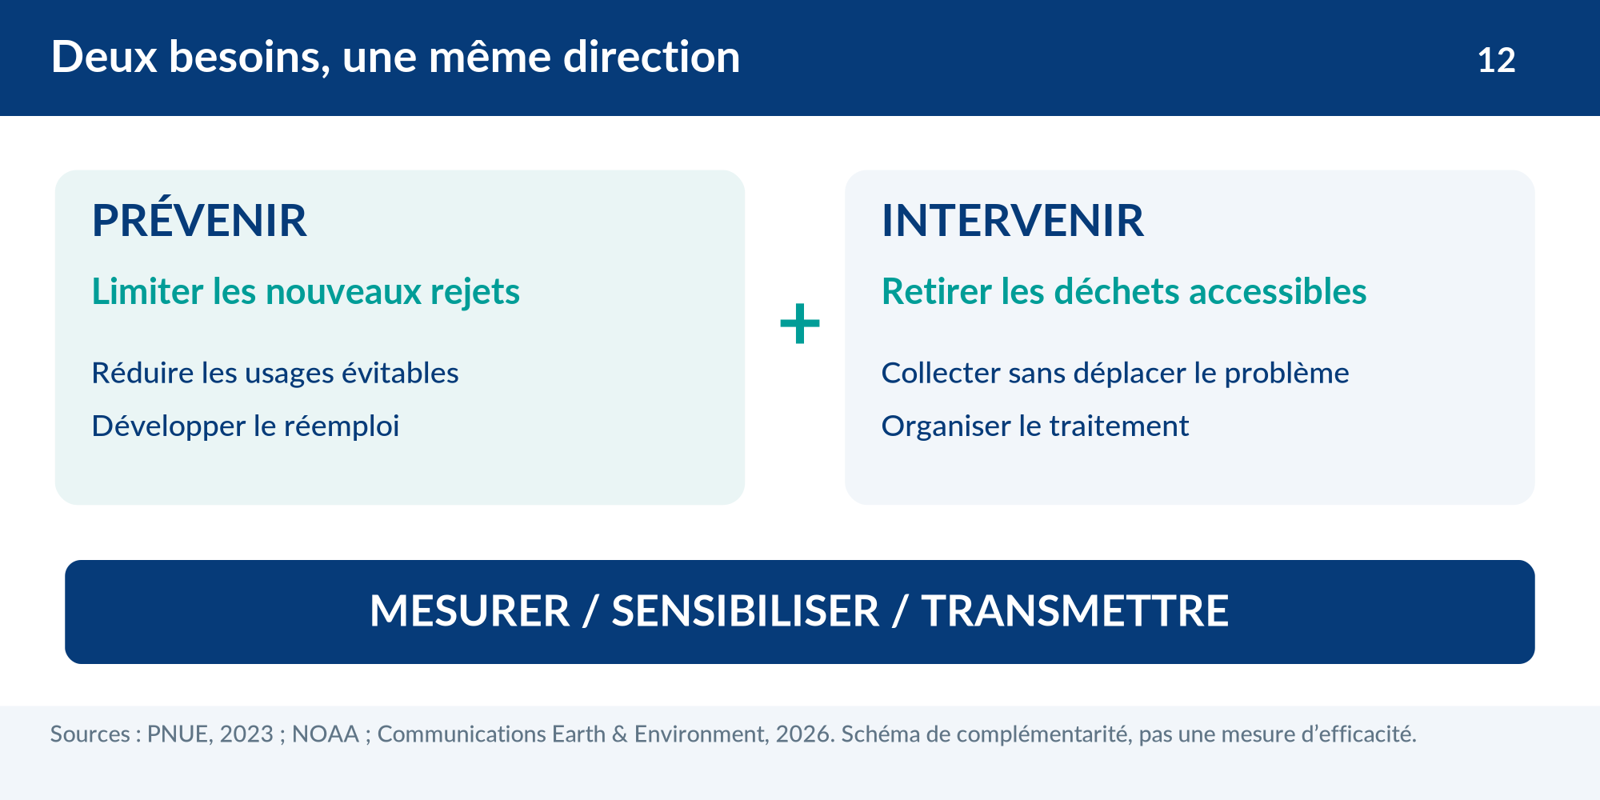
No. Preventing new waste inputs and removing accessible debris meet two complementary needs.
Reading time: approx. 3 minutes | Sources reviewed on 26.10.2026
Turn off the tap or mop up the floor? The metaphor is well known, but it poses a false choice. Preventing future waste from entering the environment and addressing what is already there can move forward hand in hand. Provided one condition is met: understanding what each action can realistically achieve. [1, 2]
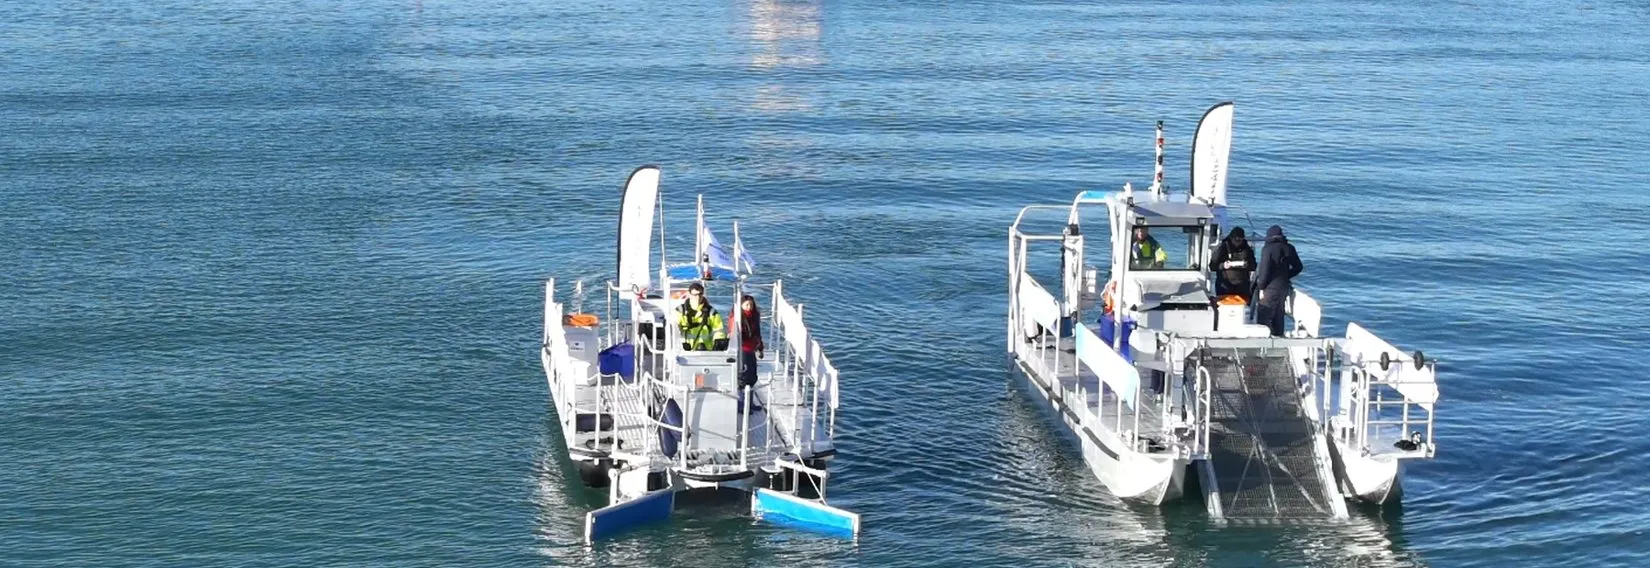
The Mobula catamarans: collection tools integrated into prevention, monitoring, and local cooperation programmes. Photo: The SeaCleaners.
The Surface Does Not Tell the Whole Story
Marine plastic does not form a single floating reservoir: a portion lies on coastlines, within the water column, or in benthic sediments. Findings vary depending on the types and sizes of plastics considered. [1] A 2023 study, for instance, estimated 3.2 million metric tons of buoyant plastics across various marine compartments for the year 2020. This figure does not correspond solely to surface water and does not cover all polymers. [1] Consequently, cleaning up surface debris is not sufficient to "drain the ocean."
Prevention Remains Indispensable
Reducing non-essential uses, expanding reuse, improving product design, and organising waste management systems all curb new waste inputs. UNEP recommends combining these approaches rather than waiting for a single silver bullet. [2] Collection operations cannot serve as a license to litter or produce without limit. In a coherent framework, cleanup accompanies prevention; it neither replaces it nor buys absolution. This is a critical principle for citizens and programme partners alike.
Existing Plastic Does Not Disappear on Demand
A modelling study published in 2026 highlights that stopping new inputs alone is insufficient to prevent the future accumulation of microplastics originating from existing waste. [3] This does not mean that all debris can be recovered, nor that every cleanup technology is environmentally beneficial. Interventions must be adapted to the local environment, minimise their own ecological footprint, and provide clear processing routes for retrieved materials. NOAA also emphasises prevention and waste reduction alongside marine debris removal efforts. [4]
Collect, Understand, Transfer
Our model combines cleanup solutions, waste characterisation, collaboration with local processing streams, and education. We aim to measure more than just tonnage: the types of items recovered, their ultimate destination, the skills transferred, and our partners' capacity to sustain operations. A successful cleanup is not just a photogenic before-and-after picture. It must fit into a durable, long-term framework. Our ambition can be summed up in a single sentence: our true success lies in making ourselves obsolete, by ensuring local actors have the resources and capability to act autonomously.
The right approach: support initiatives that clearly explain what they remove, what they prevent, and what they leave behind for local teams. Prevention and cleanup have the most to gain by working hand in hand.
Sources and further reading
- [1] Kaandorp et al., Nature Geoscience, 2023. Global mass of buoyant marine plastics dominated by large long-lived debris. View ↗
- [2] UNEP, 2023. Turning off the Tap: How the world can end plastic pollution and create a circular economy. View ↗
- [3] Communications Earth & Environment, 2026. Halting marine plastic inputs by 2050 is necessary but not sufficient to avoid microplastic accumulation. Modeling study. View ↗
- [4] NOAA Marine Debris Programme. Garbage Patches. View ↗
Guiding Principles for This Section
A figure always retains its year, geographic scope, and unit of measurement. An estimate remains an estimate. Numbered references are specific to each article and accessible via link. Field photos illustrate topics without claiming to prove the origin or exact composition of the waste.
Last literature review: 26.10.2026. Historical figures are not presented as 2026 measurements.
Understand, Then Act
Verified facts, measurable actions: help us go further.
Collection, scientific research, and awareness-raising: every donation supports all three. Your donation is tax-deductible in Switzerland.


